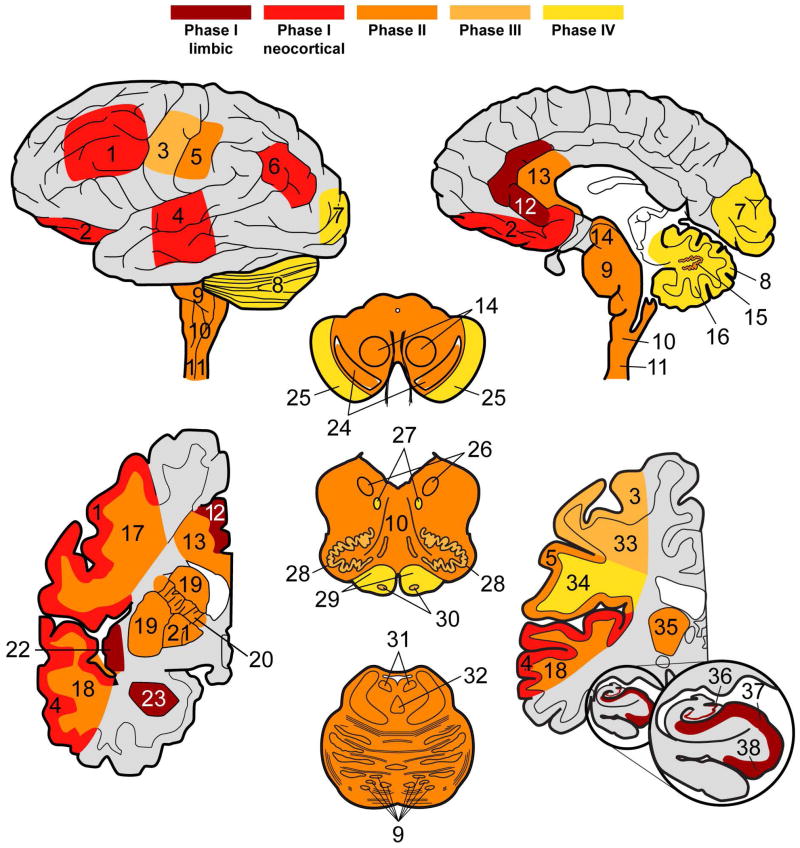
Figure 4. Patterns of PiD tau neuropathology.
Heat maps display neuroanatomic associations of sequential tau deposition in the central nervous system of PiD. Phases are defined by the extent of regional involvement of tau pathology across cases beginning with Phase I, where disease is restricted to limbic and neocortical frontotemporal regions and angular gyrus. Phase II has additional pathology in associated white matter tracts, subcortical structures and serotonergic/norandrenergic brainstem nuclei. Phase III tau neuropathology is characterized by additional pathology in primary motor cortex and pre-cerebellar nuclei in the medulla. Finally, Phase IV cases with the most severe tau pathology burden include additional tau deposits in the visual cortex and variably in the cerebellar granular layer and brainstem white matter. Key: 1=MFC, 2=OFC, 3= MOT, 4=SMT, 5=SENS, 6=ANG, 7=VIS, 8 CBGL, 9=Pons, 10, MEDRF, 11=CSC, 12=ACG, 13=CC, 14=MBRN, 15=CBDG, 16=CB WM, 17= MFC WM, 18= SMT WM, 19=STR, 20= Internal capsule, 21=GP, 22=INS, 23=AMY, 24= MBSN, 25=MB crus cerebri, 26=MEDX, 27=MEDXII, 28=MEDIO, 29=MED pyramids, 30=MED ARC/PB, 31=LC, 32=RPN, 33=MOT WM, 34=SENS WM, 35=THAL, 36= HIPP DG, 37= HIPP CA, 38= HIPP ERC.

