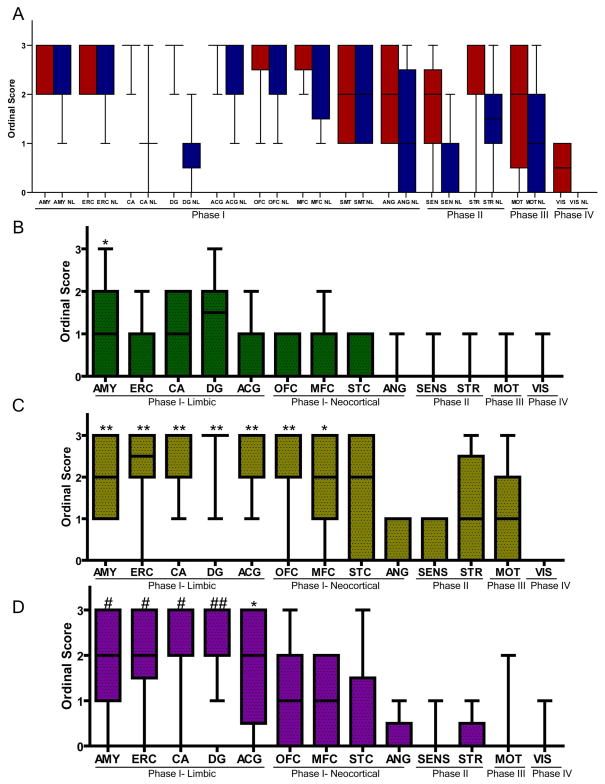
Figure 6. Ordinal scores for severity of regional tau pathology and neurodegeneration in PiD Phases I–IV.
Boxplots depict median, interquartile range and range of ordinal scores. (A) AT-8 reactive tau neuropathology (red) in 70 um sections was highly correlated with neuron loss (blue) for most regions. Overall there were higher levels of tau pathology in Phase I regions compared to additional regions affected in Phases II–IV. To further characterize Phase I regions we compared ordinal scores for markers of mature tau pathology. (B) ThS (green) reactivity was mild and most prominent in Phase I limbic regions. (C) The tau C3 C-terminal truncation specific epitope was more abundant in Phase I limbic and neocortical regions. (D) UBQ reactivity was more prominent in Phase I limbic regions. (B–D) K Kruskal-Wallis test finds a significant difference in ordinal scores between regions (p<0.0001). * denotes p<0.001 difference in post hoc region comparisons with VIS, ** with previous and ANG, SENS, # with previous and STR, MOT, ## with previous and MFC, SMT.

