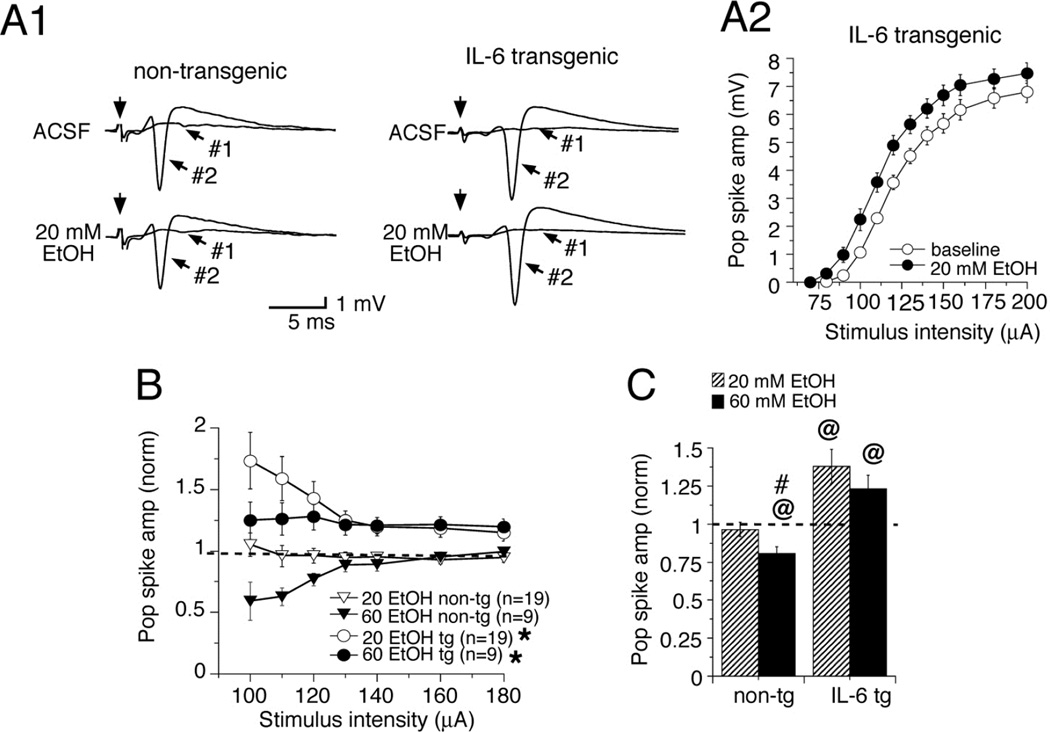
Figure 2.
Ethanol depresses the PS in non-tg hippocampal slices but enhances the PS in IL-6 hippocampal slices. (A1) Representative traces of PS evoked by Schaffer collateral stimulation (applied at the arrow) before and after acute application of 20 mM ethanol (EtOH) in non-tg and IL-6 tg slices. (A2) Representative graph showing I/O relationships for PS amplitudes mean (±SEM) over the range of stimulus intensities tested in IL-6 tg slices before ethanol (open symbols) and after ethanol (filled symbols) application of 20 mM ethanol. (B) Graph showing normalized (ethanol/control) values (mean±SEM) for PS amplitudes for the range of stimulus intensities studied (100 to 180 µA) for non-tg and IL-6 tg slices. Dashed line indicates control values (i.e., 1) for IL-6 tg and non-tg slices. (C) Mean normalized values (±SEM) for PS amplitudes averaged on an individual slice basis over the range of stimulus intensities used for studies of 20 (stripped bar) and 60 mM (solid bar) ethanol. Dashed line indicates control values (i.e., 1) for IL-6 tg and non-tg slices. Ethanol significantly depressed the PS amplitude in non-tg slices at 60 mM ethanol but not 20 mM ethanol, whereas the PS amplitude in IL-6 tg slices was increased by both 20 mM and 60 mM ethanol. *Significant difference between IL-6 tg and non-tg slices for the same ethanol concentration (Repeated measures ANOVA, p<0.05). @Significant difference from baseline values (i.e., 1) for the same genotype (one sample t-test, p<0.05). #Significant difference between 20 mM and 60 mM ethanol for the same genotype (unpaired t-test, p<0.05).

