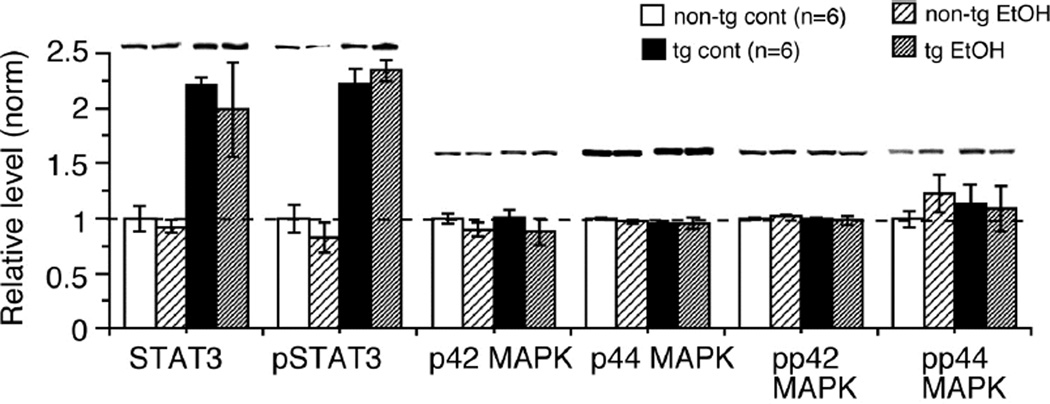
Figure 5.
Level of activation of signal transduction molecules associated with IL-6R activation was not altered by acute exposure of hippocampal slices to ethanol (60 mM, 30 min). Graph shows mean (±SEM) values for the relative level of the activated form and total (activated plus non-activated) STAT3 and p42/44 MAPK measured by Western blot in non-tg and IL-6 tg hippocampal slices. For each gel, measurements were normalized to the mean value for the non-tg hippocampus run on the same gel. Normalized values were then averaged according to genotype and protein. Representative Western blots are shown above the corresponding bars in the graph. Six slices were studied for each condition. Dotted line shows mean values for non-tg hippocampal slices (i.e., 1).

