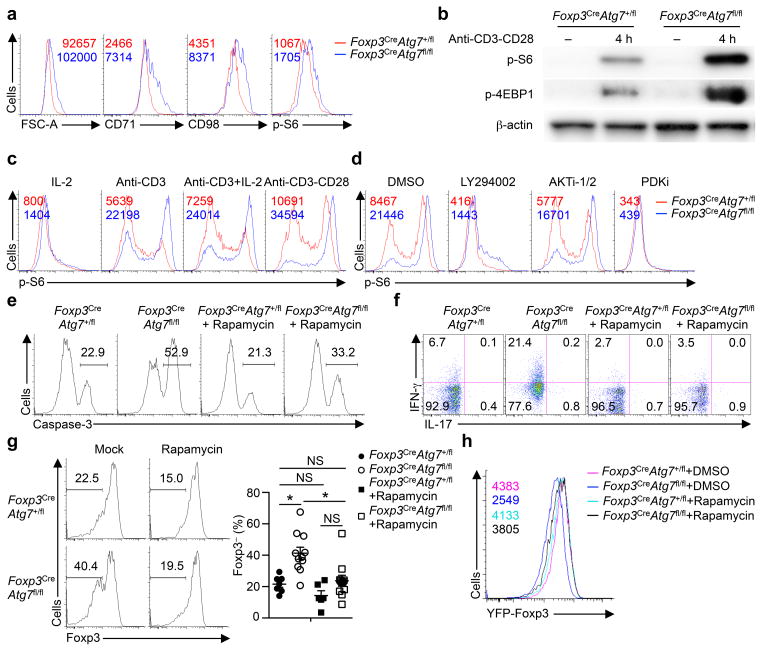
Figure 3. Atg7 restrains TCR-dependent mTORC1 activity in Treg cells.
(a) Flow cytometry analyzing cell size, and the expression of CD71, CD98 and p-S6 in Foxp3CreAtg7+/fl and Foxp3CreAtg7fl/fl splenic Treg cells. Numbers above graphs indicate MFI of FSC-A, CD71, CD98 or p-S6. (b) Immunoblot analysis of p-S6 and p-4EBP1 in resting, and anti-CD3 and antiCD28-stimulated Treg cells from Foxp3CreAtg7+/fl and Foxp3CreAtg7fl/fl mice. (c) Flow cytometry analyzing p-S6 expression in Foxp3CreAtg7+/fl and Foxp3CreAtg7fl/fl Treg cells stimulated with the indicated stimuli for 4 h. Numbers above graphs indicate MFI of p-S6. (d) Flow cytometry analyzing p-S6 expression in Foxp3CreAtg7+/fl and Foxp3CreAtg7fl/fl Treg cells stimulated with anti-CD3 and anti-CD28 for 4 h in the presence of DMSO, LY294002 (10 μM), AKTi-1/2 (1 μM) or PDKi (10 μM). Numbers above graphs indicate MFI of p-S6. (e,f) Foxp3CreAtg7+/fl and Foxp3CreAtg7fl/fl mice received mock or rapamycin treatment. Treg cells were isolated and stimulated overnight with anti-CD3, anti-CD28, and IL-2 for analysis of caspase-3 activity (e) or stimulated for 4 h for analysis of IFN-γ and IL-17 expression (f). Numbers above bracketed lines indicate percent caspase-3+ cells (e), and numbers in quadrants indicate percent cells in each (f). (g) Foxp3CreAtg7+/fl or Foxp3CreAtg7fl/fl Treg cells were transferred into Rag1−/− mice, followed by mock (n=7 mice for Atg7+/fl and n=11 mice for Atg7fl/fl) or rapamycin (n=6 mice for Atg7+/fl and n=11 mice for Atg7fl/fl) treatment. Flow cytometry analyzing Foxp3 expression (left), and frequency of Foxp3− cells (right) in divided donor cells (gated on CD4+TCRβ+) in the PLNs of recipients. Numbers above bracketed lines indicate percent Foxp3− cells. (h) Flow cytometry analyzing YFP-Foxp3 expression in divided Treg cells from Foxp3CreAtg7+/fl and Foxp3CreAtg7fl/fl mice, following DMSO or rapamycin treatment and activation with anti-CD3, anti-CD28, and IL-2 in vitro for 96 h. NS, not significant (P > 0.05); * P < 0.05 (one-way ANOVA in g). Data are representative of three (a,b,d–f,h) or two (c) experiments, or pooled from three out of three (g) experiments (mean ± s.e.m in g).

