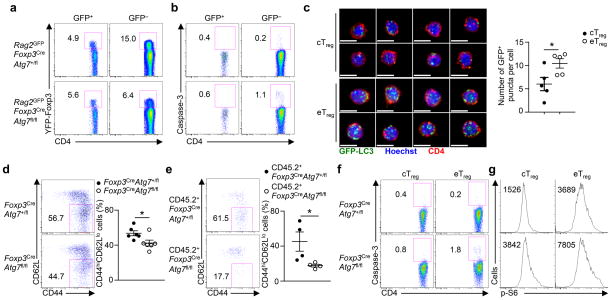
Figure 7. Autophagy is preferentially required for activated Treg cell maintenance.
(a,b) Flow cytometry analyzing the expression of YFP-Foxp3 in GFP+ and GFP− CD4+ T cells (a) and active caspase-3 in GFP+ and GFP− Treg cells (b) in the spleen of Rag2GFPFoxp3CreAtg7+/fl and Rag2GFPFoxp3CreAtg7fl/fl mice. Numbers adjacent to outlined areas indicate percent YFP-Foxp3+ cells (a) and caspase-3+ cells (b). (c) Representative images (scale bars, 5 μm) (left) and quantification of the number of GFP-LC3+ puncta per cell (right) in cTreg and eTreg cells purified from the spleen of GFP-LC3 mice (n=5 mice). (d,e) Flow cytometry analyzing the proportion of CD44hiCD62Llo eTreg cells among total Treg cells in the spleen of Foxp3CreAtg7+/fl and Foxp3CreAtg7fl/fl mice (n=6 mice per genotype) (d, left) and Foxp3CreAtg7+/fl and Foxp3CreAtg7fl/fl chimeras (n=4 mice per group) (e, left), and frequency of CD44hiCD62Llo eTreg cells (d,e, right). Numbers adjacent to outlined areas indicate percent CD44hiCD62Llo eTreg cells (d,e, left). (f,g) Flow cytometry analyzing the expression of active caspase-3 (f) and p-S6 (g) in CD44loCD62Lhi cTreg cells and CD44hiCD62Llo eTreg cells in the spleen of Foxp3CreAtg7+/fl and Foxp3CreAtg7fl/fl mice. Numbers adjacent to outlined areas indicate percent caspase-3+ cells (f), and numbers above graphs indicate MFI of p-S6 (g). * P < 0.05 (two-tail unpaired Student’s t-test in c–e). Data are representative of five (a,f), three (b,g), or four (e) experiments, or pooled from two out of two (c) or five out of five (d) experiments (mean ± s.e.m in c–e).

