
Figure 4.
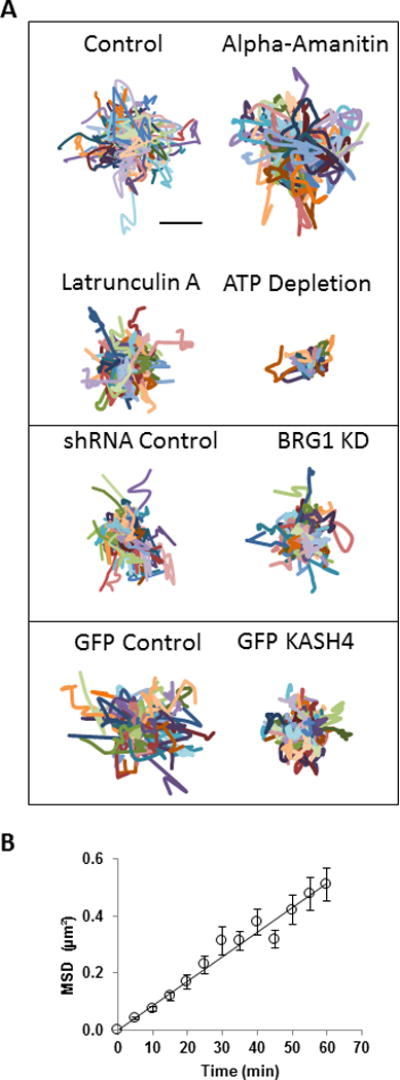
Analysis of random motion of speckles. A) Trajectories of randomly moving speckles (corrected for nuclear drift) are shown for control cells, alpha-amanitin treated cells, Latrunculin A treated cells and ATP depleted cells (compare with control cells), shRNA control cells and BRG1 knockdown cells (compare with shRNA control cells), GFP control cells and GFP KASH4 cells (compare with GFP control cells). Each color represents the trajectory of an individual speckle. The trajectories were measured from time-lapse images acquired for 1 hr with 5 min time intervals. Bar, 1 μm. B) Plot of the average MSD of speckles in control cells as a function of time, and the corresponding regression fit line. The linear profile suggests that the speckle motion follows a simple random walk. Error bars represent the standard error of the mean, n ≥ 120 speckles.