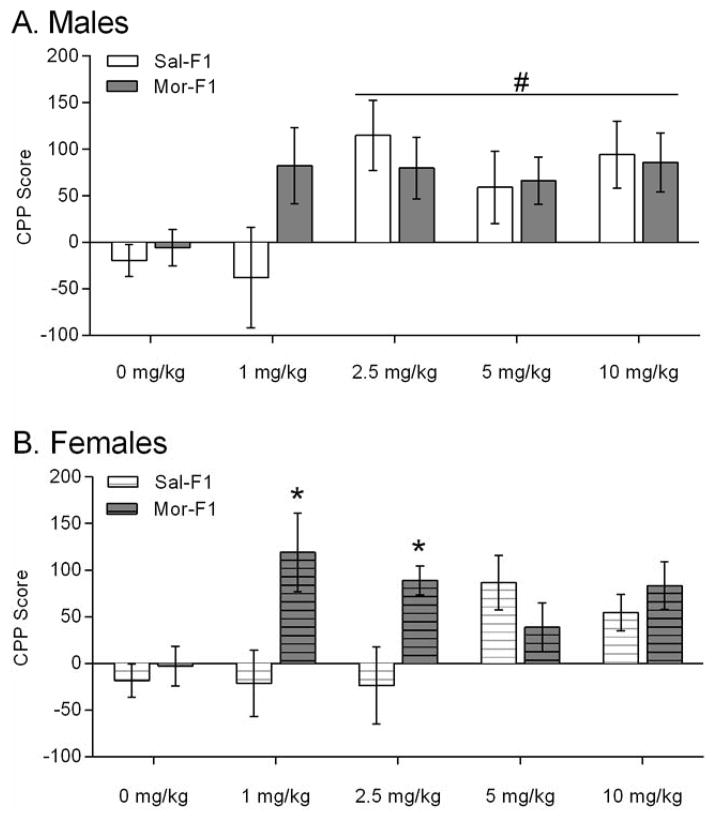
Figure 3.
Conditioned place preference data expressed as the CPP score (Time spent in the conditioned side – time spent in non-conditioned side on the day of the 15-minute post test). Data are expressed as mean +/− SEM. Panel A shows the male data and Panel B shows the female data. * p<0.05 compared to Sal-F1 at the same dose. #p<0.05 main effect of dose. N=9–15/group

