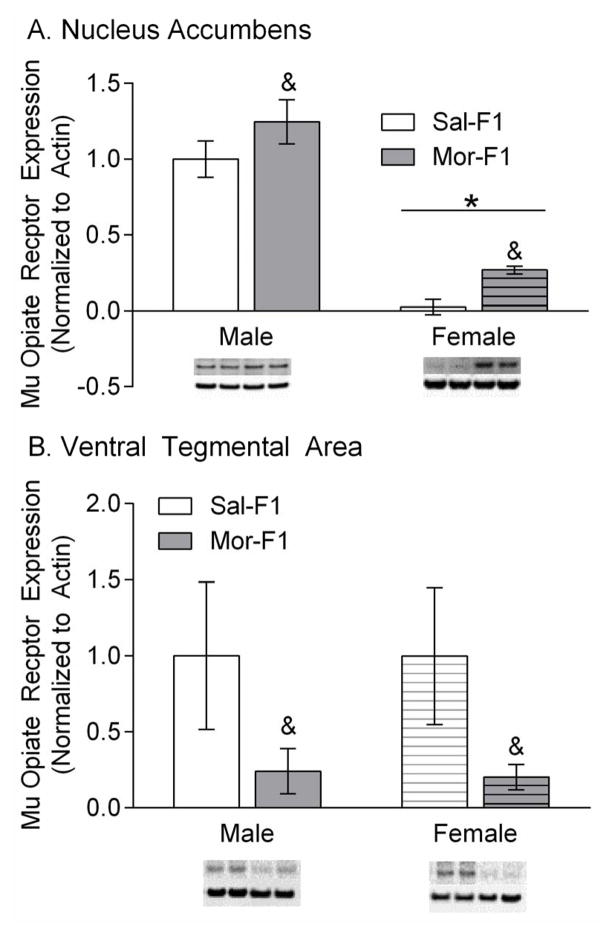
Figure 5.
Mu Opioid Receptor (MOR) expression in the Nac (Panel A) and VTA (Panel B). Data are expressed as % of control and normalized to beta actin. All samples were run in duplicate or triplicate. Representative images from the blots are placed below the bar graph. & refers to p<0.05 main effect of maternal treatment and * refers to p<0.05 main effect of sex n=5–6/group

