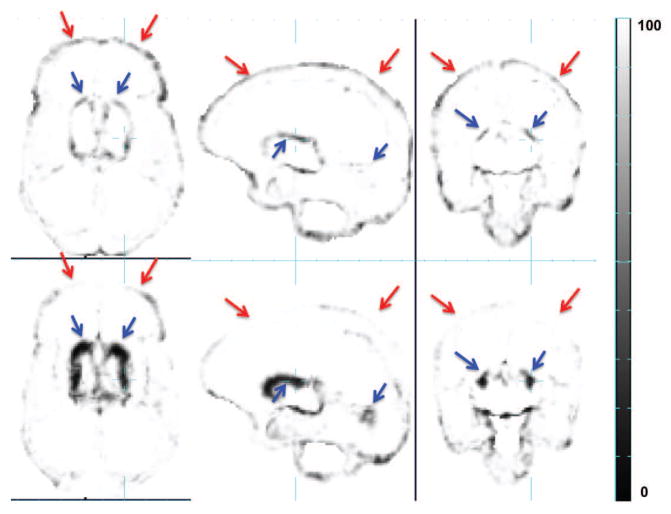
Figure 11.
Comparison between Voxel Label Accuracy (VLA) maps resulting from EM segmentation using atlas-based (top row) and patch-based (bottom row) tissue probabilities as running priors. VLA values are on a scale of 0–100%. Red arrows: patch-based tissue probabilities is more accurate at sCSF/GM and GM/WM boundaries; Blue arrows: atlas-based tissue probabilities is more accurate at DGM/WM boundaries.

