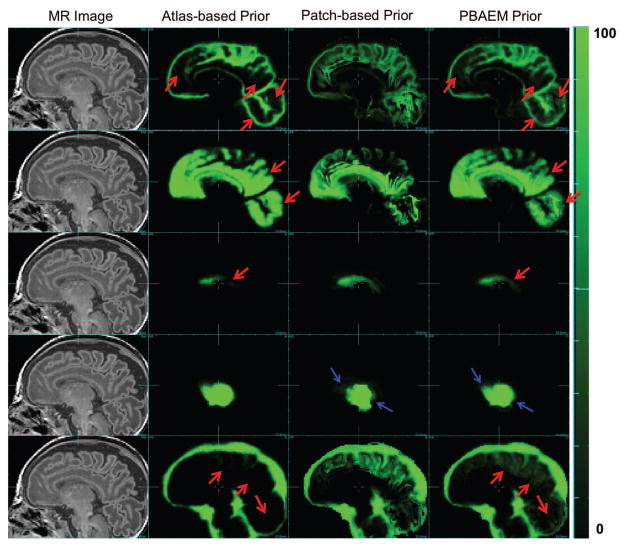
Figure 6.
Examples of running priors. From left to right: Raw MR image (column 1), atlas-based ( ) (column 2), patch-based (column 3) and PBAEM (column 4) tissue probability map of, from top to bottom, GM, WM, VENT, DGM and sCSF of one subject as an example. Tissue probability on a scale 0 – 100. Red arrows: PBAEM tissue probability is more accurate than the atlas-based one; Blue arrows: PBAEM tissue probability is more accurate than the patch-based one.

