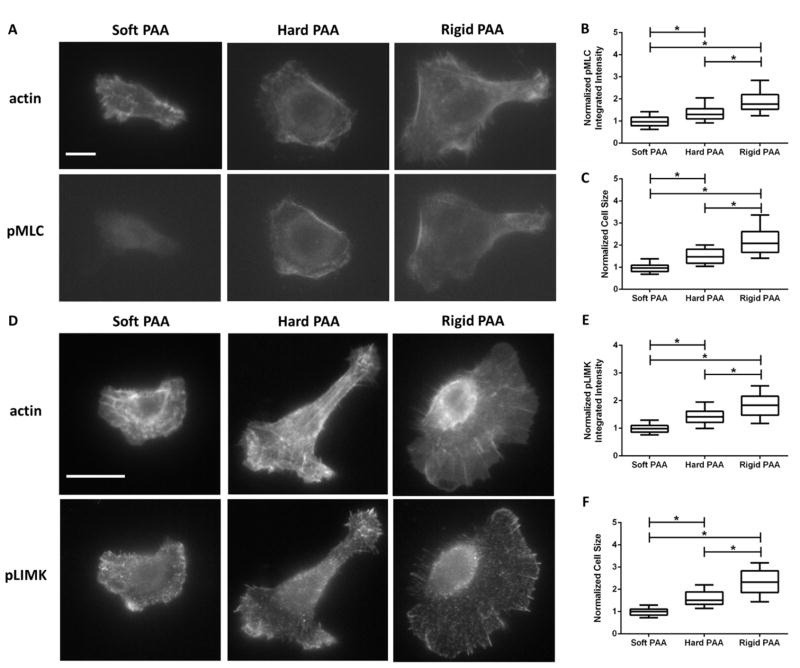
Figure 3.
Overall cellular pMLC and pLIMK levels are dependent on matrix rigidity. Representative wide-field fluorescence images of SCC-61 cells immunostained for actin and (A) pMLC or (D) pLIMK on soft, hard, and rigid polyacrylamide gels used in the traction force assays. Quantitation of (B) pMLC and (E) pLIMK normalized integrated intensities and cell sizes from (C) pMLC and (F) pLIMK immunostaining. Data are presented as box and whisker plots with the black lines indicating the medians, the whiskers representing the 10th and 90th percentiles, and * indicating p<0.05 for n=84–87 and 83–89 cells for pMLC and pLIMK experiments, respectively, from 4 independent experiments. Scale bars represent 10 μm.

