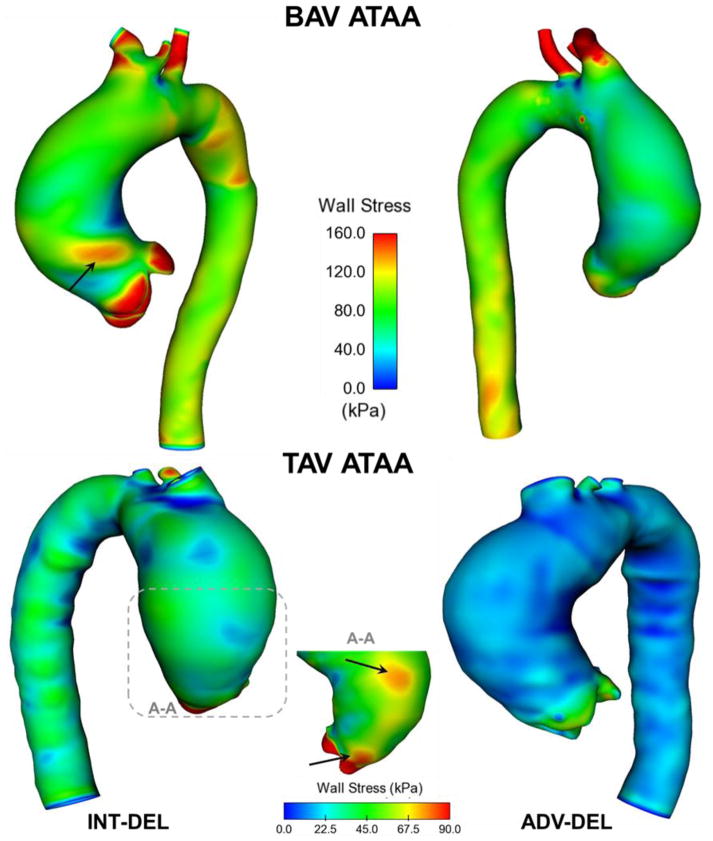
Fig 5.
Comparison of maximum principal stress in both ADV-DEL (right models) and INT-DEL (left models) for both BAV ATAA and TAV ATAA simulations utilizing the anisotropic, fiber-reinforced structural model with structural parameters quantified by multi-photon imaging analysis; the black arrows indicate local maxima of wall stress

