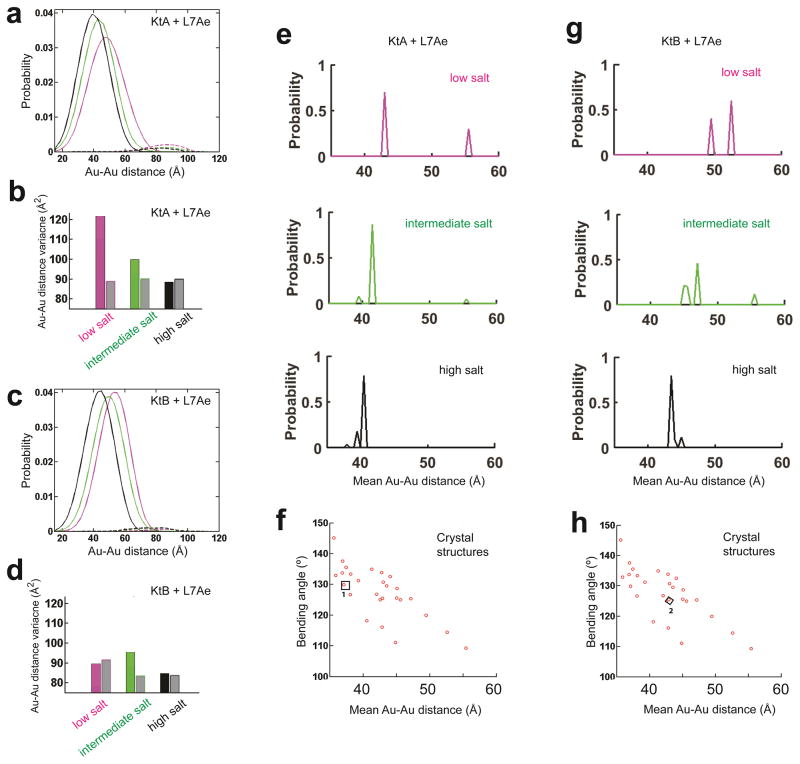
Figure 5. The KtA•L7Ae and KtB•L7Ae ensemble and their salt dependence.
(a, c) The measured Au-Au center-to-center distance distribution for KtA•L7Ae and KtB•L7Ae (Fig. 1b) under low, intermediate, and high salt conditions (Condition 2, 3 and 5 in Fig. 2, colored in magenta, green, and black, respectively) decomposed into contributions from kinked (solid line in a and c) and unkinked (dashed line in a and c) conformations for KtA•L7Ae (a) and KtB•L7Ae (c). The very small amount of unkinked RNA (<6%; dashed lines) could represent damaged RNA or experimental noise. (b, d) The distance variance of the kinked ensemble for KtA•L7Ae (colored bar in b) and KtB•L7Ae (colored bar in d) compared with the predicted variance for a single kinked conformation (grey bars in b and d). (e, g) The probability distribution of the kinked ensemble for KtA•L7Ae (e) and KtB•L7Ae (g) at each solution condition, obtained by decomposing the kinked contributions (solid line in a and c) into contributions from basis set kinked conformations (f and h). The mean Au-Au distances of the conformers were binned with 0.5 Å intervals. (f, h) Basis set kinked conformations constructed using available crystal structures of kink-turns, including the isolated KtA·L7Ae (1 in f) and KtB·L7Ae (2 in h). f and h are aligned with e and g on their x-axes, respectively. The mean Au-Au distances plotted in e–h were obtained as described in Figure 3 in order to allow direct comparisons of the RNA structures without interference from salt-dependent Au-nanocrystal effects.

