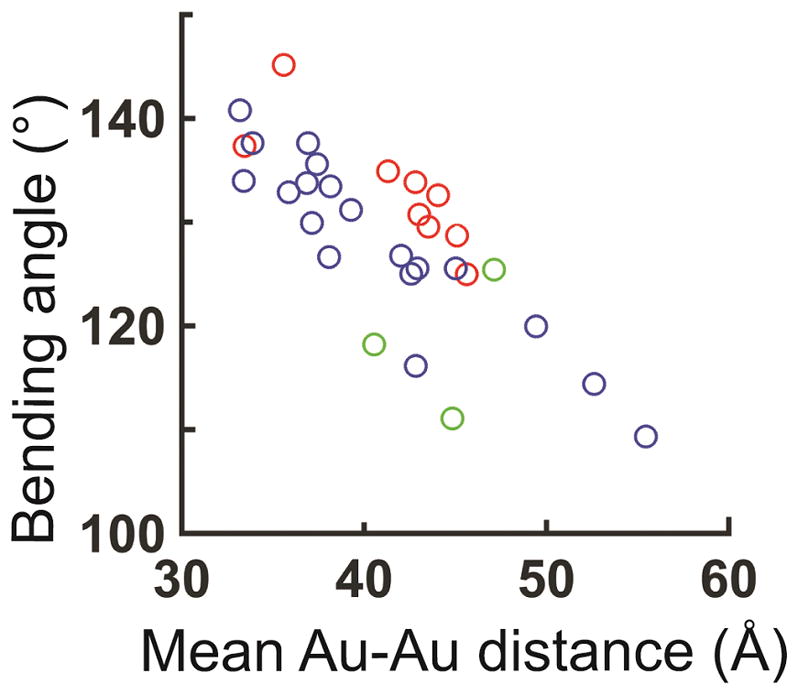
Figure 6. The distribution of N1 and N3-type kink-turn conformations.

The distribution of inter-helical bending angles and the expected mean Au-Au distance for the crystal structures of N1 (red), N3 (blue), and kink-turn conformations that do not fall in either N1 or N3 class (green). Figure 6 is a replot of the red region in Figure 1d.
