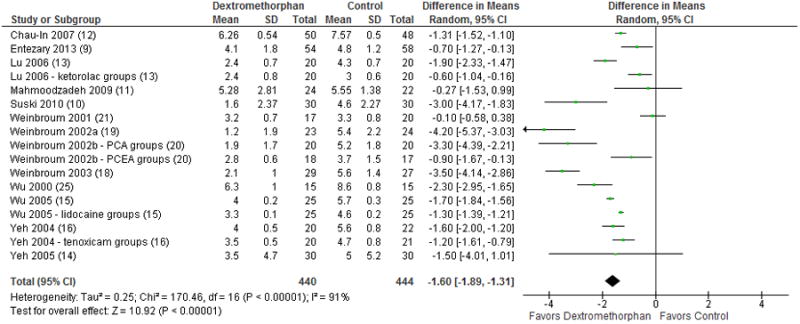
Figure 3.

Forest plot for comparison of pain scores at 1 hour post-op. The table displays the study with reference number in parenthesis, mean, standard deviation, sample size, difference in means of visual analog scale with 95% confidence interval, heterogeneity, overall effect, and p-value. The Forest plot displays point estimate and 95% confidence interval. CI = confidence interval, PCA = patient-controlled analgesia, PCEA = patient-controlled epidural analgesia, SD = standard deviation.
