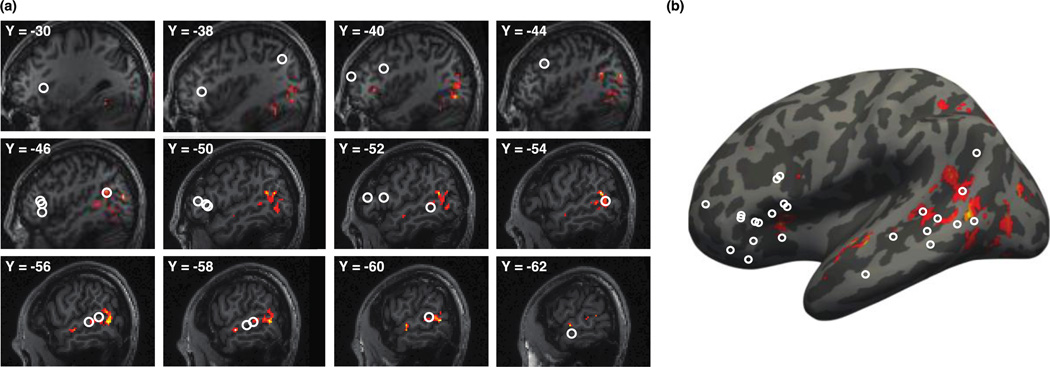
Figure 3.
Syntactic complexity effects in the left hemisphere identified with traditional group analysis. Both (a) and (b) show the activation map of our critical contrast, object-extraction > subject-extraction (p<0.001, uncorrected for whole-brain multiple comparisons) in hot colors. White circles show the locations of activations to similar syntactic complexity contrasts reported in prior studies as reviewed by Friederici (2011; referred to in that paper as “studies of movement”). Notice that the activations in the current study fall within the same general locations found previously, namely, the posterior middle temporal gyrus and the inferior frontal gyrus. (a) The effects are superimposed on sagittal slices of an anatomical scan from one of our participants. (b) The effects are projected onto an inflated cortical surface of an average brain in MNI space.

