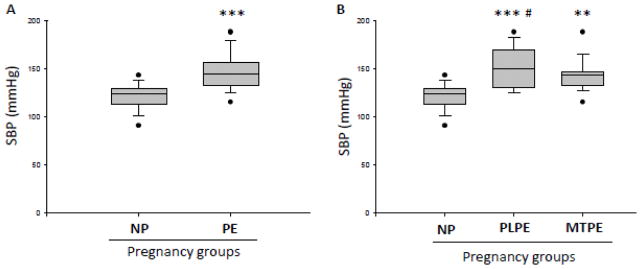
Figure 1. Systolic blood pressure in normal pregnancy and preeclampsia.
A) Comparison of systolic blood pressure (SBP) presented as the highest measurement during hospital admission per subject in normal pregnancies (NP) and preeclampsia (PE). B) SBP measured as above in NP and PE patients subdivided into placental PE (PLPE, gestational age at delivery < 34 weeks) and maternal PE (MTPE, gestational age at delivery ≥ 34 weeks). Data are presented as a mean and standard error of the mean (SEM). *** - p<0.001, as compared to control (NP) by t-test; ***# -p<0.001 and ** - p<0.01, as compared to control (NP) by one-way ANOVA followed by Tukey’s multiple comparison test.

