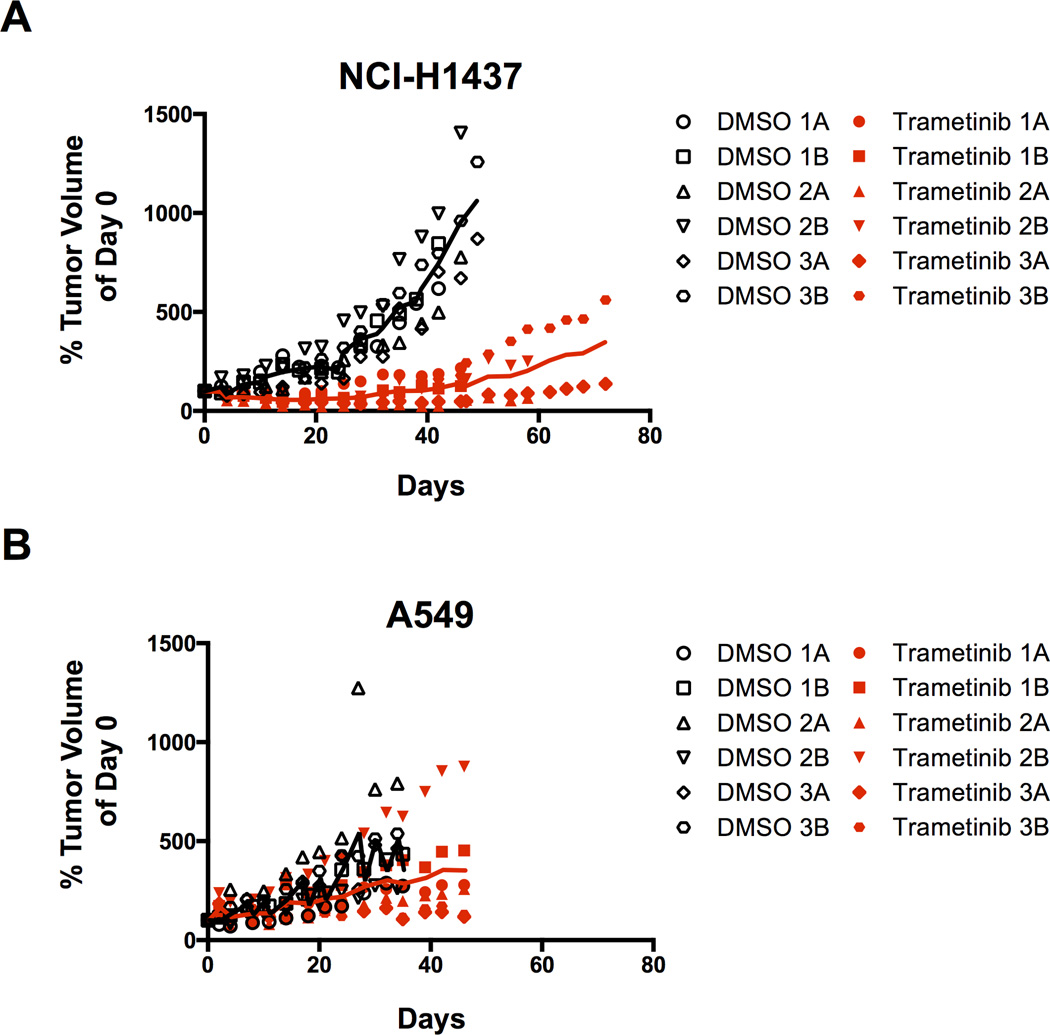
Figure 4.
(A) Xenograft tumor growth after NCI-H1437 subcutaneous injection in nude mice. Mice were treated daily with either vehicle (5% DMSO) or 0.3mg/kg trametinib. Each number represents a single mouse and the letters A and B represent each tumor. Tumor volume was normalized to its size at the start of drug treatment. Solid lines indicate the average of the six tumors for each treatment. The differences between trametinib and control treatments for all days after day 8 were statistically significant (p<0.007). Control mice were all sacrificed during the experiment due to excessive tumor burden. All trametinib treated mice were sacrificed at the conclusion of the experiment.
(B) Xenograft tumor growth after A549 subcutaneous injection in nude mice. Mice were treated daily with either vehicle (5% DMSO) or 0.3mg/kg trametinib. For each tumor, the volume was normalized to the size at the start of drug treatment. Control and trametinib treated mice were all sacrificed during the experiment due to excessive tumor burden.

