Figure 5.
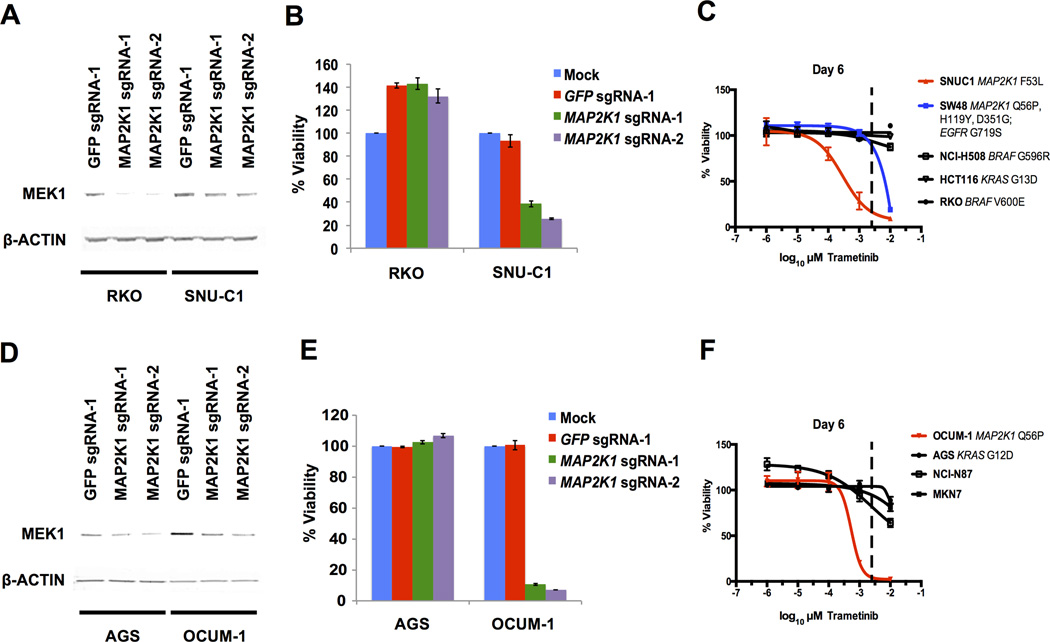
(A) Immunoblot of MEK1 and β-ACTIN (loading control) protein levels from pooled population of cells 5 days after lentiviral infection of Cas9 with control sgRNA targeting GFP or two independent sgRNAs targeting MAP2K1 in RKO and SNU-C1 cells.
(B) Cell viability beginning 7 days after Cas9/sgRNA infections. Viability is normalized to mock infected controls for each cell line.
(C) Trametinib dose response curve after 6 days. Cell viability normalized to DMSO treated controls. The dashed line approximately represents the serum concentration achieved from the recommended dose determined from Phase I clinical trials (25).
(D) Immunoblot of MEK1 and β-ACTIN (loading control) protein levels from pooled population of cells 5 days after lentiviral infection of Cas9 with control sgRNA targeting GFP or two independent sgRNAs targeting MAP2K1 in AGS and OCUM-1 cells.
(E) Cell viability beginning 7 days after Cas9/sgRNA infections. Viability is normalized to mock infected controls for each cell line.
(F) Trametinib dose response curve after 6 days. Cell viability normalized to DMSO treated controls. The dashed line approximately represents the serum concentration achieved from the recommended dose determined from Phase I clinical trials (25).

