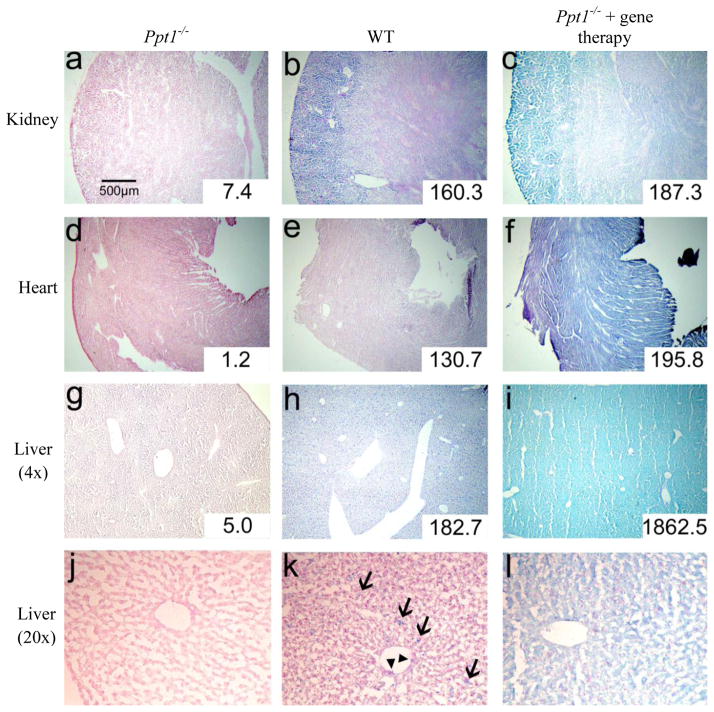
Figure 5. PPT1 activity in adult tissues following AAV2/9-PPT1-mediated gene therapy.
Kidney (a–c), heart (d–f), and liver (g–i) tissues were stained for PPT1 activity (blue) using CUS-9235, then counterstained with nuclear fast red. Liver tissue at high magnification (20×) is shown in panels j–l. Arrows (→) indicate cells in the liver parenchyma, likely to be Kupffer cells, and arrowheads (▶) indicate sinus-lining cells. From left to right in each row, groups are: untreated Ppt1−/−, WT, Ppt1−/− + intravenous AAV2/9-mediated gene therapy. Quantitative enzyme activity is shown in the inset for each tissue and is presented as nmol/mg/hr. Note: stained sections from adult Ppt1−/− and WT animals are the same as presented in Fig. 4. Sections displayed were chosen because they represent staining in all animals within each group.S

