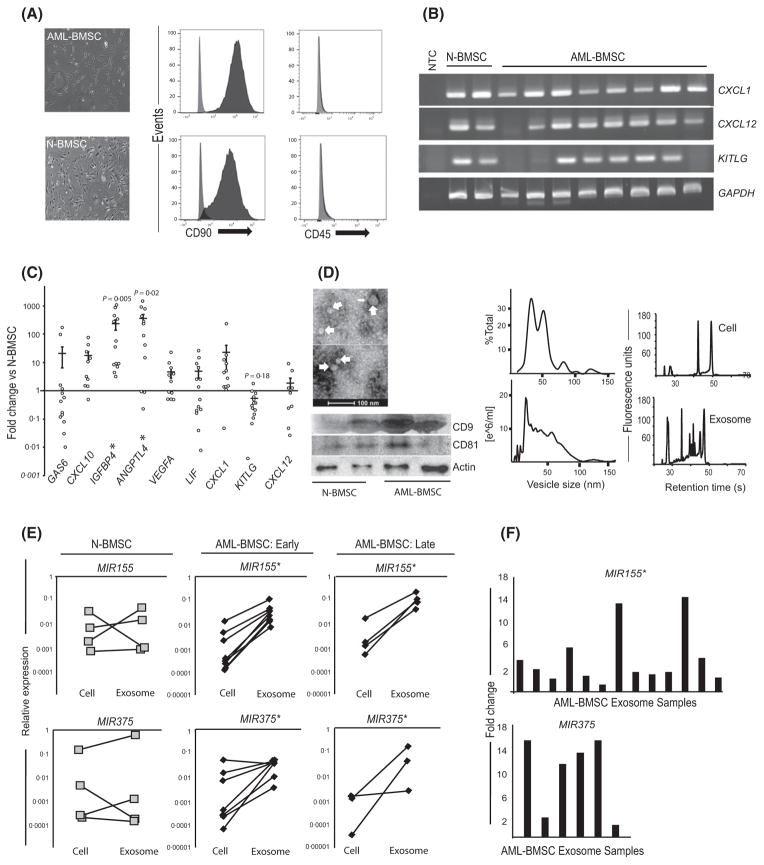
Fig 1.
AML-BMSCs have altered gene expression profiles and release exosomes that are enriched in select mi-RNA. (A) Light micrograph and immunophenotype of primary AML-BMSCs and N-BMSCs showing adherent, fibroblastic morphology and positivity for CD90 and negativity for CD45 epitopes. (B) mRNA expression of stromal transcripts C-X-C Chemokine Ligands CXCL12, CXCL1 and KITLG (SCF). (C) Quantitative expression by polymerase chain reaction of select gene transcripts from AML-BMSCs (n = 13) normalized to N-BMSCs (n = 4, n = 3 for CXCL12). Expression is calculated relative to GAPDH, p-values reflect mean differences between N-BMSCs and AML-BMSCs for the genes shown. (D) Electron micrograph of 30–100 nm sized, cup-shaped vesicles (top left) showing the presence of the exosome markers CD9 and CD81 from both populations (bottom left). Vesicle size and concentration, by percentage of 100 vesicles measured from transmission electron microscope (middle top) and by nanovesicle tracking analysis (middle bottom) from AML-BMSC and N-BMSC. Bioanalyser electropherogram of RNA from stromal cells and their exosomes (right top and bottom), revealing enrichment of small RNA in stromal exosomes. (E) Graphs display the relative abundance of MIR155 and MIR375 in parent stromal cells versus the exosomes released during the same passage number, expressed relative to snRNA U6. Each cell-exosome pair is derived from a separate patient. ‘Early passage’ cells were used from their second to fourth passage, and ‘late-passage’ cells were used in their 10–12th passage; *P < 0·05 by Student’s t-test for mean differences between parent cells and their exosomes. (F) Each vertical bar represents fold increases of MIR155 (n = 13) or MIR375 (n = 6) 6from different primary AML-BMSC exosomes, normalized to the mean of 3 N-BMSC exosome isolates. Sample size differences between miRNA targets reflect senescence in samples between the timing of the two experiments; *P < 0·05 by Student’s t-test for mean differences in expression. AML-BMSC, bone marrow stromal cells from acute myeloid leukaemia patients; N-BMSC, normal bone marrow stromal cells; NTC, non-template control.

