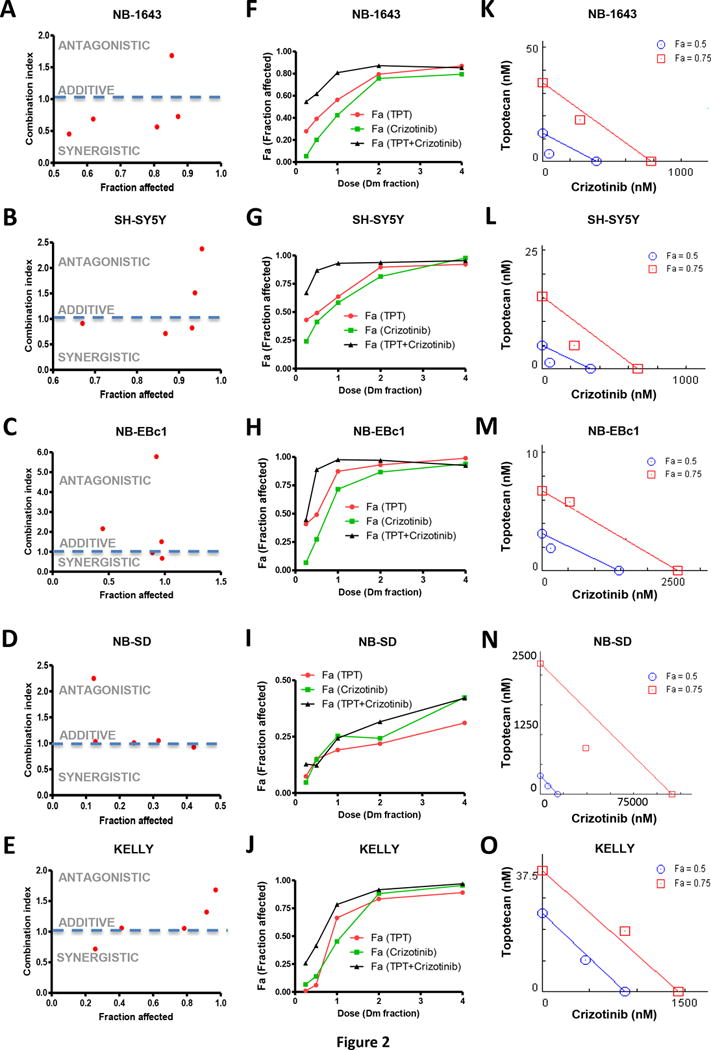
Figure 2.

In vitro synergy analysis of crizotinib and topotecan (TPT) in neuroblastoma cells. Combination index (CI) is presented as a function of fraction affected (Fa) in NB cells: (A) NB-1643, (B) SH-SY5Y, (C) NB-EBc1, (D) NB-SD and (E) KELLY. Dose response curves are shown where the dose of drug, as a fraction of the respective Dm values from the cell lines (F) NB-1643, (G) SH-SY5Y, (H) NB-EBc1, (I) NB-SD and (J) KELLY, is plotted against the fraction affected (Fa) values. In the isobologram analysis of (K) NB-1643, (L) SH-SY5Y and (M) NB-EBc1, (N) NB-SD and (O) KELLY, the diagonal colored line indicates additivity, whereas the red and blue symbols indicate dose requirements to achieve 50% and 75% of growth inhibition with single agents and combination treatment, respectively. Data points below the line of additivity indicate synergy whereas data points above it signify antagonism.
