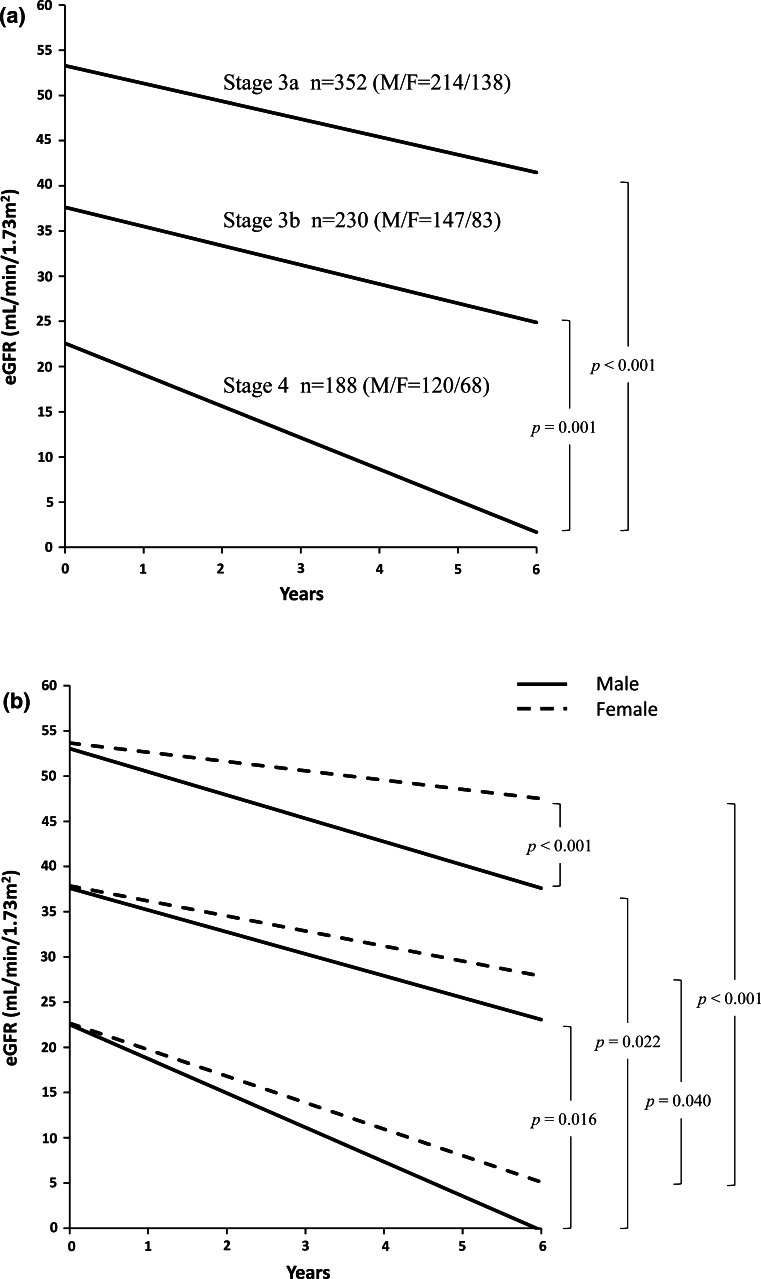
Fig. 3.
The slope of eGFR decline according to CKD stages. a The slope of eGFR decline in total patients. M male, F female. p < 0.001 (ANOVA followed by Tukey post-test). b Sex difference in the slope of eGFR decline. The slope of stage 4 was significantly steeper than that of stage 3a or 3b (ANOVA followed by Tukey post-test). The difference between male and female was seen in stage 3a, p < 0.001 (unpaired t test)

