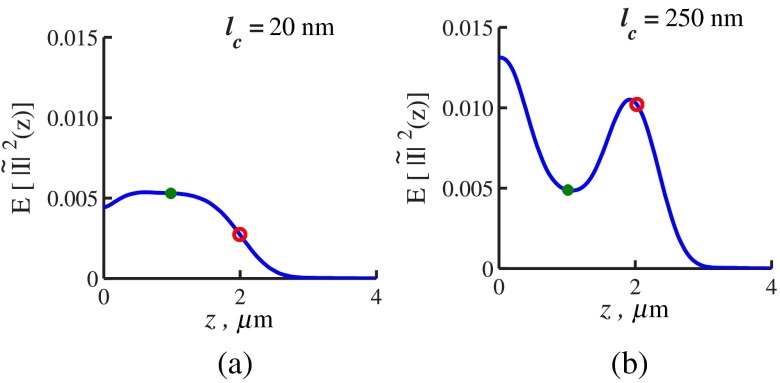
Fig. 3.
is obtained by FDTD. Sample thickness , exponential functional form of RI spatial distribution with correlation length (a) (exemplifying a case when ) and (b) (exemplifying a case when ). On each curve, the depth at which is evaluated shown by red circles, and depth is used for evaluation by green dots. The shape of changes with due to the difference in the functional forms of and .

