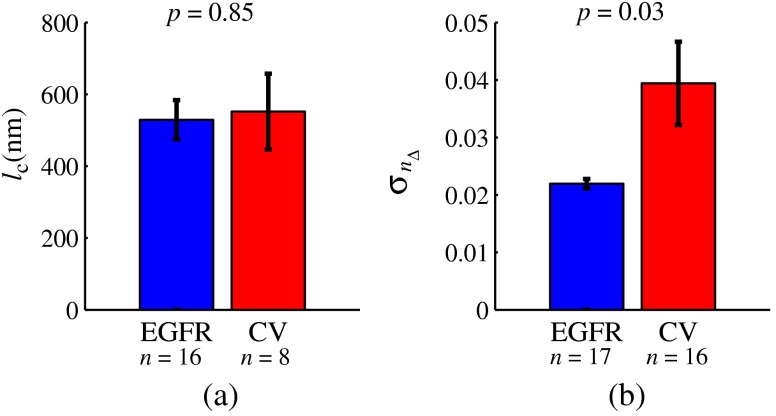
Fig. 9.
Length scale and standard deviation of RI distribution: (a) RI correlation lengths within CV and EGFR cells as measured from SM data; error bars are standard errors; (b) a drastic difference between the RI standard deviation within CV and EGFR cells measured from SM data following the reconstruction algorithm; error bars are standard errors.

