Figure 2.

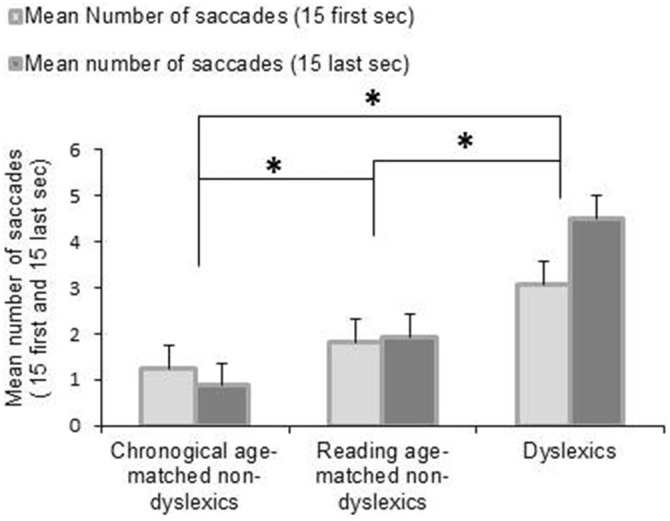
Mean values of number of saccades during fixation task for the first 15 and the last 15 s. Vertical bars indicate the standard error. Asterisk indicates a significant difference between the three groups of children.

Mean values of number of saccades during fixation task for the first 15 and the last 15 s. Vertical bars indicate the standard error. Asterisk indicates a significant difference between the three groups of children.