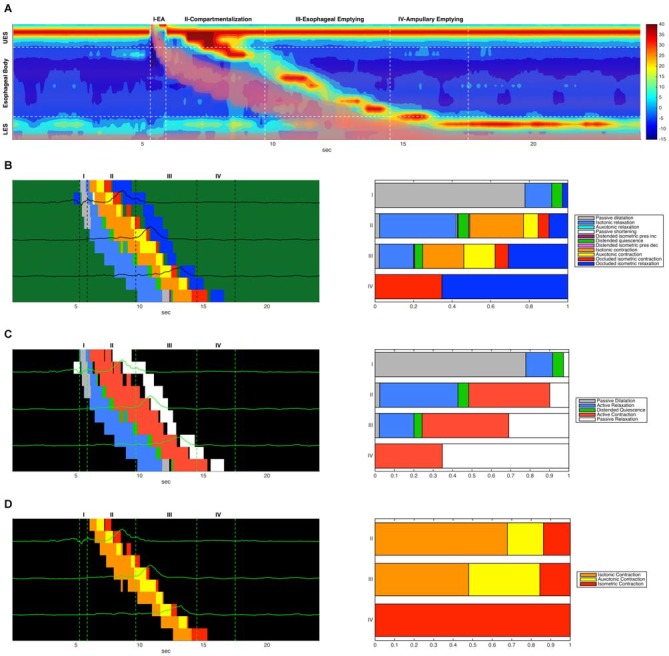
Figure 10.

(A) Combined admittance-pressure topography for an example swallow. The presence of the bolus is indicated by pink shading in areas of low impedance. Also indicated are four time regions corresponding to the four phases of bolus transit described in Lin et al. (2014). (B) A combined mechanical state map (left) showing mechanical state distributions for different regions. Each horizontal colored strip represents the admittance-pressure-based state map at a single catheter location where impedance was recorded. Pressure time series plots at each location are overlaid on the state maps. Only the state map for the main esophageal body is shown. Also shown (right) is the proportional distribution of mechanical states that occurred in each of the four transit phases (occluded quiescence is omitted). (C) A corresponding simplified state map showing only active contractions and relaxations, passive dilatation and relaxation, and distended quiescence. (D) A corresponding state map that displays only the three forms of active esophageal contraction (isotonic, auxotonic and isometric).
