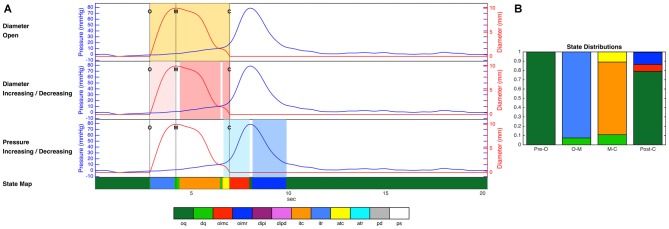
Figure 4.
(A) Diameter and pressure time series for one example swallow, as well as the decisions regarding luminal opening, diameter change and pressure change used by the decision tree, and the final prediction of mechanical state over the whole time period (colored strip at the bottom of the figure). Dotted vertical lines on the time series plots (A) indicate key events related to the opening and closing of the lumen (O, luminal opening; M, maximal luminal extent; C, luminal closure). Orange shaded areas indicate the time period when the lumen is open. Light pink shading indicates diameter increasing, and darker pink indicates diameter decreasing. Light blue shading indicates pressure increasing, and darker blue indicates pressure decreasing. (B) The proportional distribution across states during the four time periods up until luminal opening (Pre-O), during luminal opening to maximal extent (O–M), during luminal closure (M–C), and after luminal closure (Post-C). The periods before and after the opening and closing of the lumen in these figures are dominated by occluded quiescence, while isotonic relaxation predominates during luminal opening, and isotonic and auxotonic contraction predominate during luminal closure. In addition, isometric contraction and relaxation are both present following luminal closure. Key to state labels: oq, Occluded Quiescence; dq, Distended Quiescence; oimc, Occluded Isometric Contraction; oimr, Occluded Isometric Relaxation; dipi, Diameter Increase + Pressure Increase; dipd, Diameter Increase + Pressure Decrease; itc, Isotonic Contraction; itr, Isotonic Relaxation; atc, Auxotonic Contraction; atr, Auxotonic Relaxation; pd, Passive Dilatation; ps, Passive Shortening.

