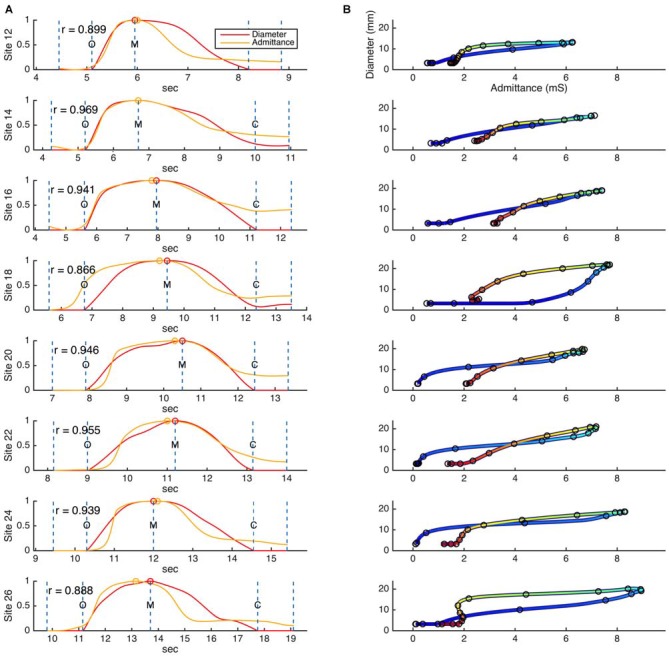
Figure 5.

(A) Example time correlations and (B) orbit plots between diameter and admittance, as measured for a single swallow across eight different catheter sites in the distal esophagus. Dashed lines on the time correlation plots (A) indicate the beginning and end points of the correlation region, and key events related to the diameter data (O, luminal opening; M, maximal luminal extent; C, luminal closure). Circular markers indicate the maximum values of diameter and admittance. Color in the orbit plots (B) changes with time, from blue at the beginning of the correlation period to red at the end of the correlation period.
