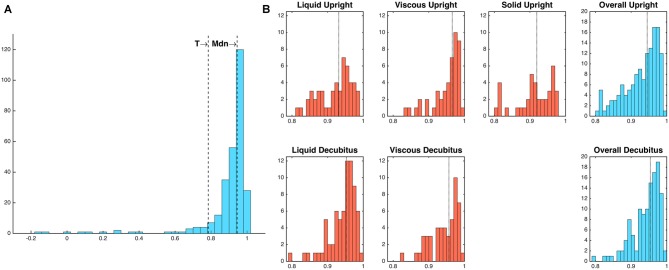
Figure 6.
(A) Frequency distribution of diameter-admittance correlations (Pearson’s rho). Mdn, median; T, threshold value for outlying values (1.5 times the interquartile range below the lower quartile). (B) Frequency distributions of diameter-admittance correlations in relation to bolus type and body position (Note that a solid bolus was not administered in the decubitus position). Median values are indicated by vertical dotted lines. Twenty-four outlying values below threshold T have been omitted for ease of interpretability.

