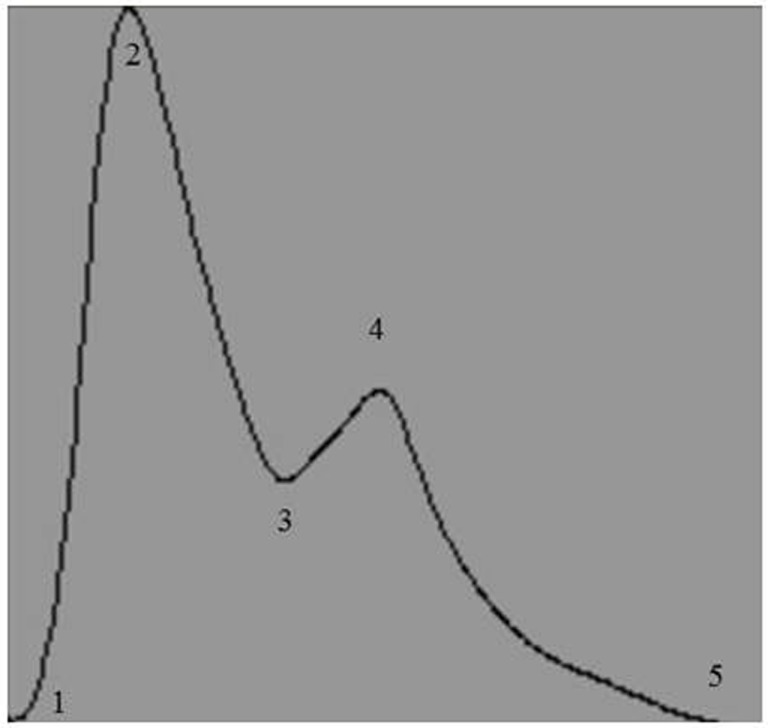
Figure 1.
Representative output of the composite arterial pulse wave obtained after analysis by a customized arterial pulse contour analysis program. Numbers represent the temporal events identified by investigators: 1, start of systole; 2, peak systolic pressure; 3, dicrotic notch pressure; 4, peak pressure of the reflected wave; and 5, end of pulse wave.

