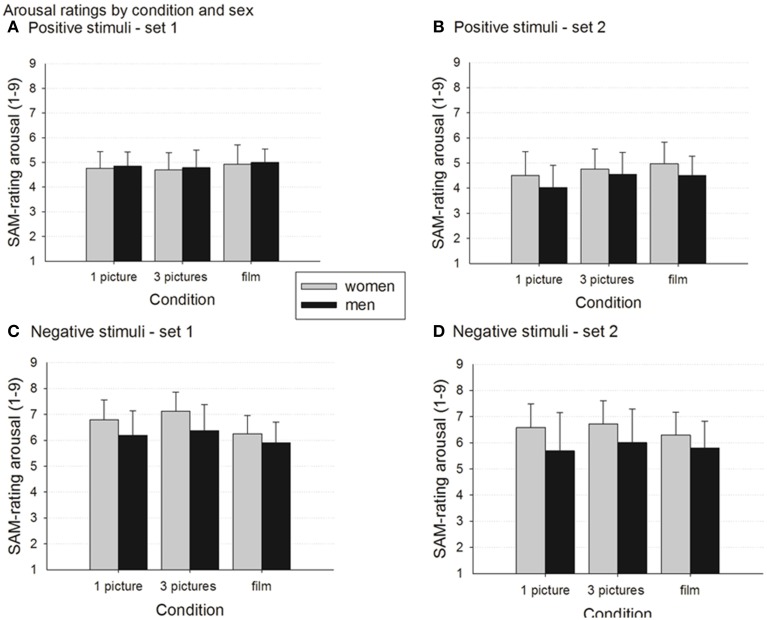
Figure 2.
Arousal ratings by stimulus condition and gender. Data presented as group means ± standard deviations. Higher ratings represent higher arousal. For results of significance tests see text. (A) Set 1 positive stimuli. (B) Set 2 positive stimuli. (C) Set 1 negative stimuli. (D) Set 2 negative stimuli.

