FIGURE 2.
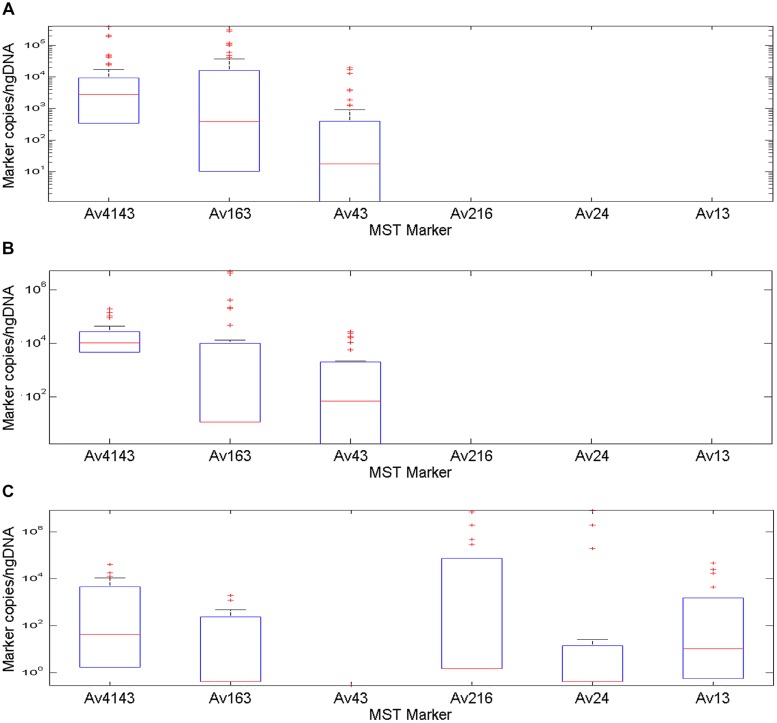
A box plot diagram demonstrating copy number of MST markers Av4143, Av163, Av43, Av216, Av24, and Av13, identified in fecal samples collected from battery hens, poultry and waterfowls normalized to nano-grams of DNA. Boxes exhibit 25 and 75 percentiles, lines within boxes represent median values and plus signs identify outliers. (A) A marker profile pattern from fecal battery hens revealed occurrence of three different makers: two general avian markers, Av4143 and Av163, and the Av43 poultry and battery hen marker, which was identified at a lower rate. (B) The marker profile signature of poultry samples was very similar to that of battery hens. (C) An avian marker profile of the waterfowl group comprised five of the six tested markers: Av4143 and Av163, the general avian markers, were identified to a lower extent than they were in battery hens or in poultry. The other three markers showed a wide range of quantification scales.

