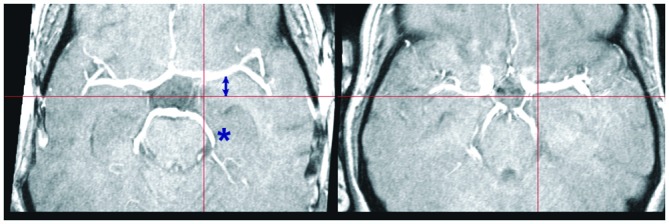
Figure 4.

Individual variation in large vessel course. Transversal slices of two TOF images selected to illustrate individual variation in the course of the middle and posterior cerebral arteries. The crosshair selects the same MNI coordinates at z = −14. Note the displacement of the middle (arrow) and posterior cerebral arteries (asterisk) in these two subjects relative to the crosshair arms (red bars). Although the two brains are correctly normalized, as shown by the location of the notch in the brain profile corresponding to the Sylvian fissure, the position of the vascular tree depends on the precise shape of the brainstem and temporal lobes, which may differ considerably between individuals.
