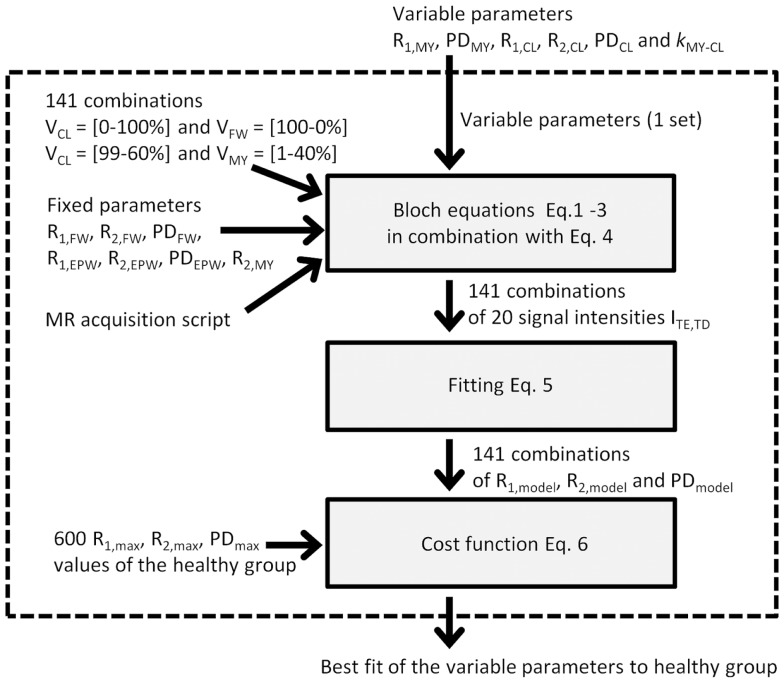
Figure 2.
Schematic depiction of the procedure to optimize the variable parameters: One set of variable parameters is chosen and evaluated within the dotted box. Evaluation is performed by running the Bloch equations of the simulated MR acquisition on 141 combinations of VMY, VCL, and VFW. This provides 20 signal intensities at various echo times and saturation delays times. The 20 signal intensities are fitted, resulting in an R1, R2, and PD value of the model. The model values are then compared to the observed R1, R2, and PD values of the healthy group using the maximum values in the 2D histograms. A cost function provides a measure for closeness of the model R1, R2, and PD values to the observed R1, R2, and PD values. The evaluation is performed for many sets of variable parameters, resulting in the best fit.

