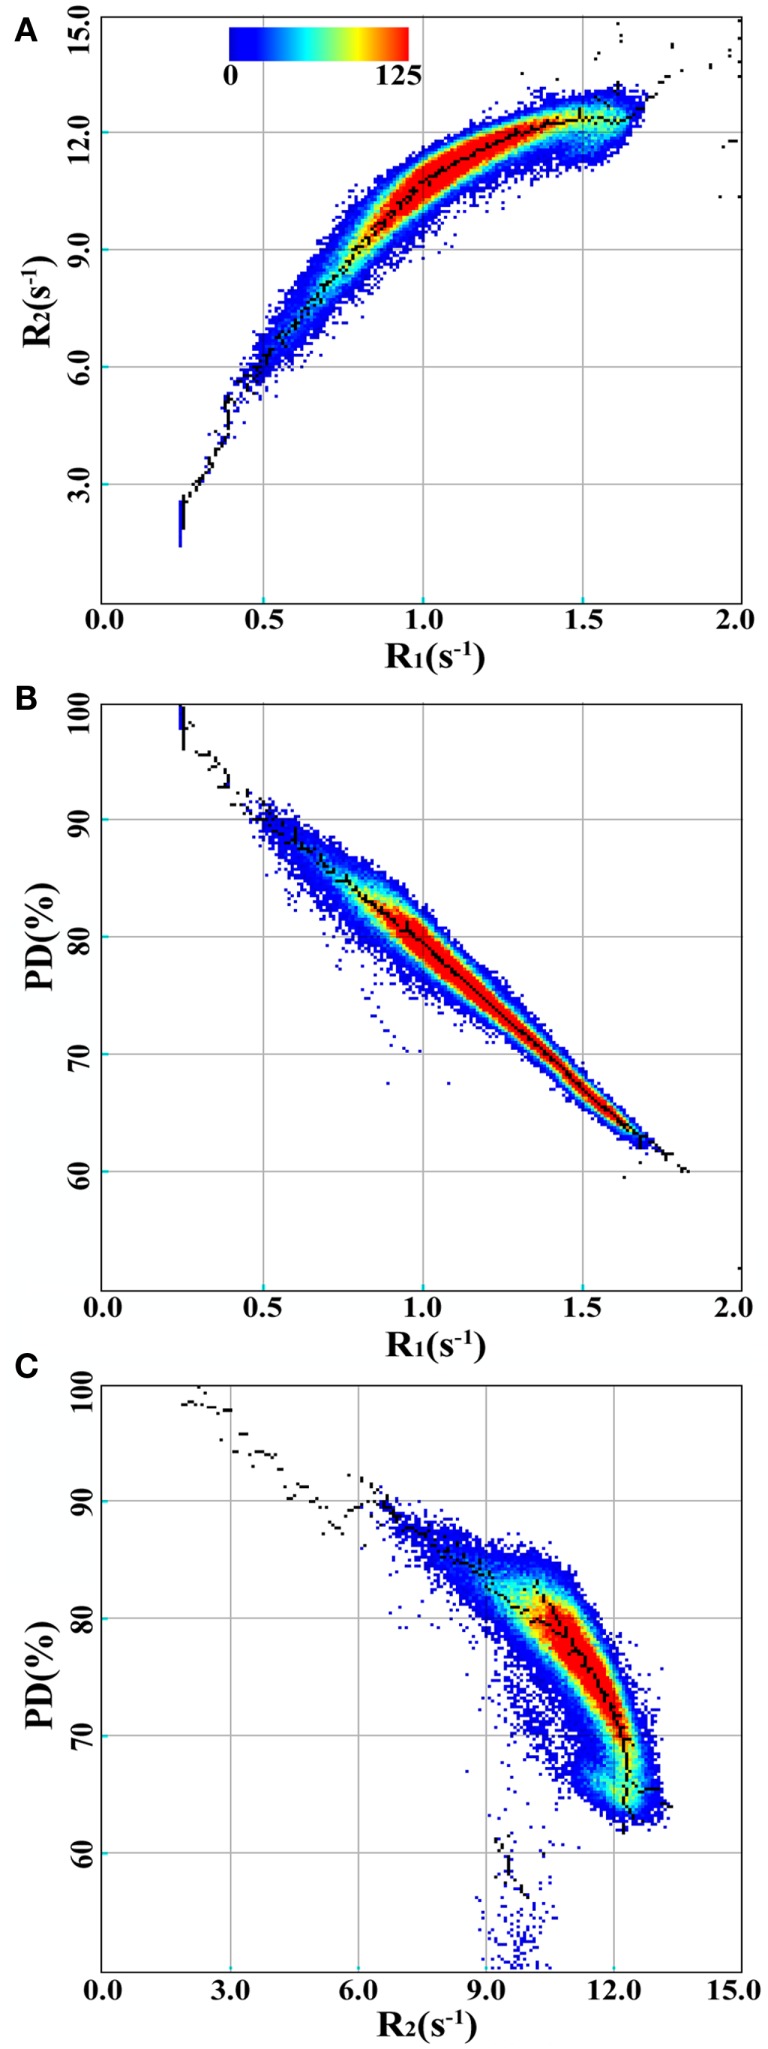
Figure 3.
2D-histograms of R1, R2, and PD values for the spatially normalized brain images of the group of control subjects. The 2D-histograms of R1 and R2, R1 and PD, and R2 and PD are shown in (A–C), respectively. The color scale indicates the number of voxels for each coordinate. The black dots are placed at the maximum values of the 2D-histograms in each direction.

