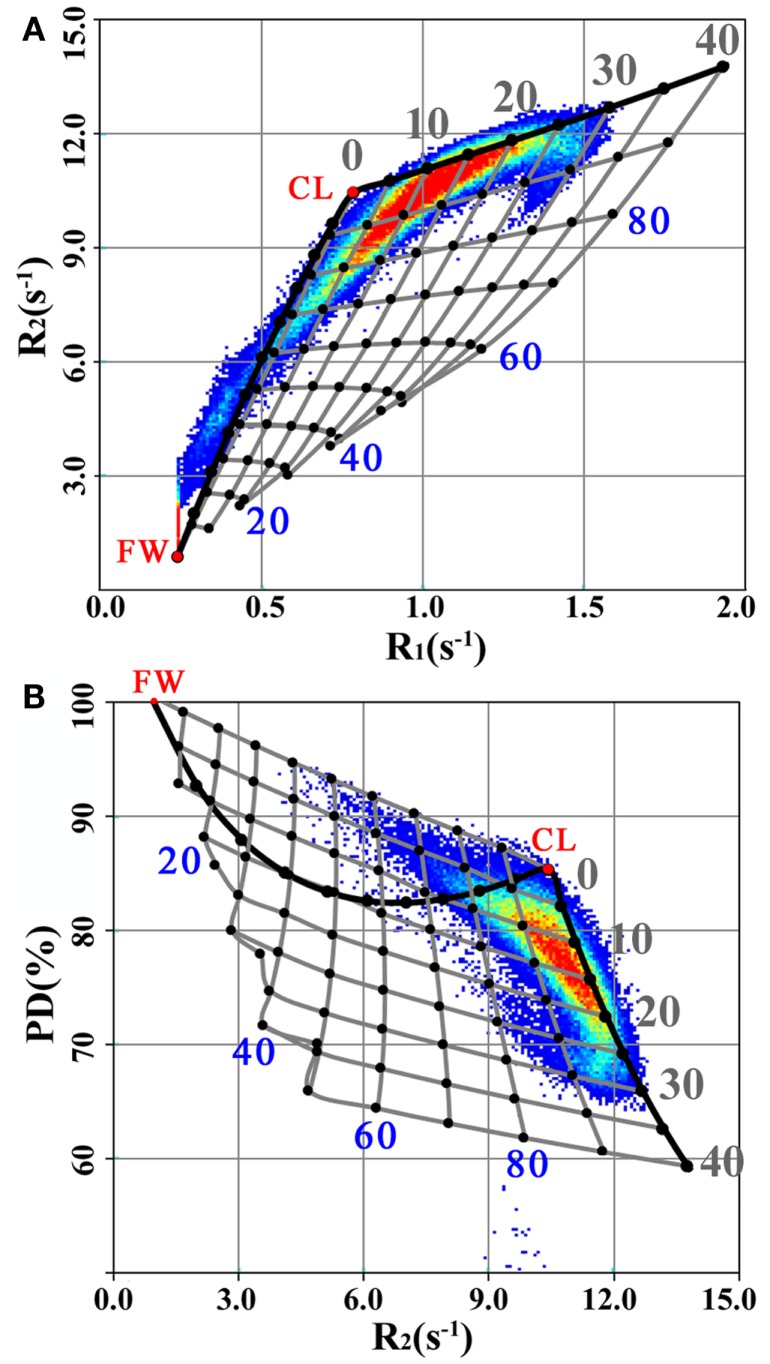
Figure 4.
R1, R2, and PD values for the spatially normalized brain images of the group of MS patients, plotted in the same manner as Figure 3 for the R1–R2 (A) and R2–PD (B) projections. Additionally, the thick black line indicates the transition from 100% VFW (the red dot at “FW”) to 100% VCL (the red dot at “CL”) until 40% VMY, using the model parameter settings for the healthy controls (Table 1). The grid of gray lines indicates the expected changes in R1, R2, and PD values for the pathological brain under myelin loss (Figure 1C) and under the presence of excess parenchymal water (Figure 1D). The cross points of the grid are placed at each 5% change in VMY and each 10% change in VEPW. The VMY partial volume is indicated by the gray numbers 0–40%. The VEPW partial volume is indicated by the blue numbers 20–80%.

