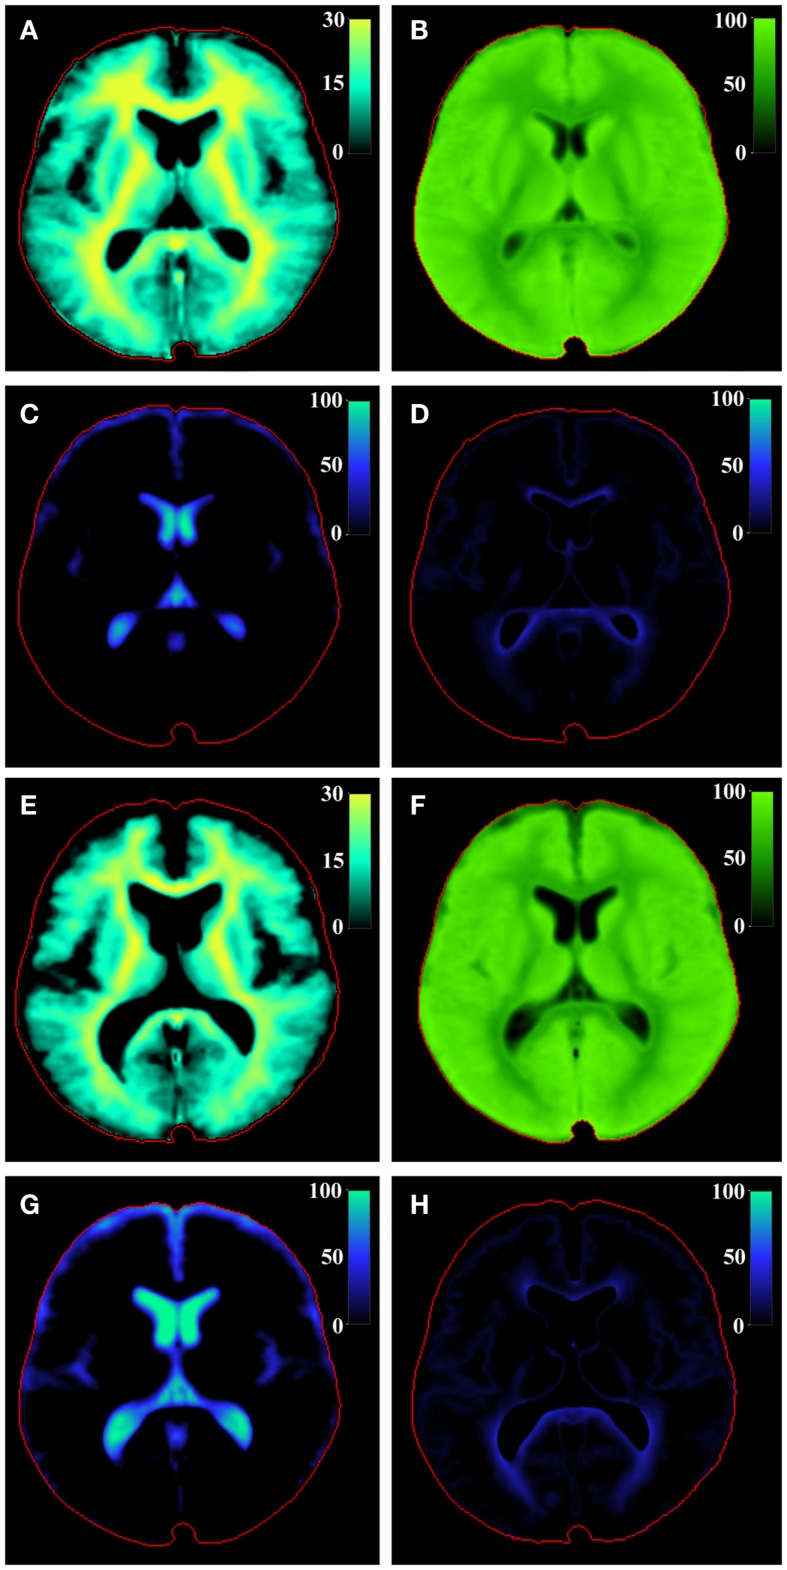
Figure 5.
Model calculation of (A) VMY, (B) VCL, (C) VFW, and (D) VEPW of the central slice of the brain of the spatially normalized group of healthy controls and of the spatially normalized group of MS patients [(E–H), respectively]. The red line indicates the intracranial volume. Note that VMY is scaled to 30%, whereas the other partial volumes are scaled to 100%.

