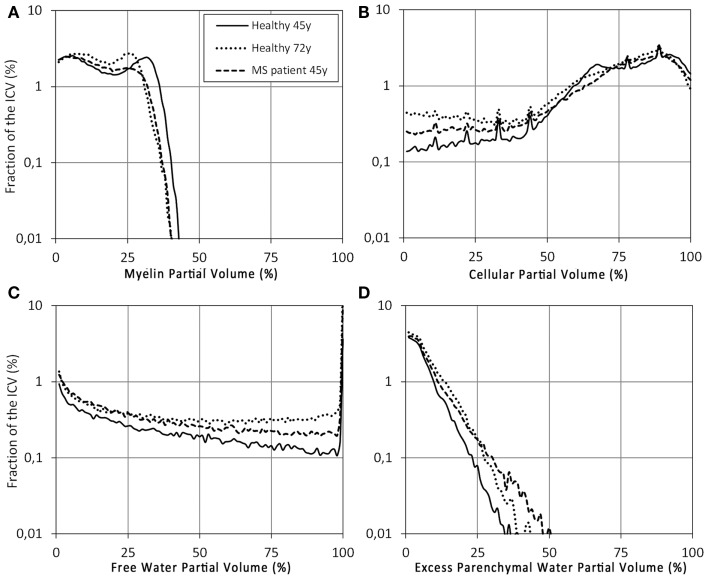
Figure 7.
Histograms of the (A) VMY, (B) VCL, (C) VFW, and (D) VEPW partial volume distributions of the control subject (solid line), elderly control subject (dotted line), and MS patient (dashed line) from Figure 6. The x-axis was divided into 100 bins of 1% partial volume over the range 0–100%. The scaling on the y-axis is logarithmic, as a percentage of the ICV.

