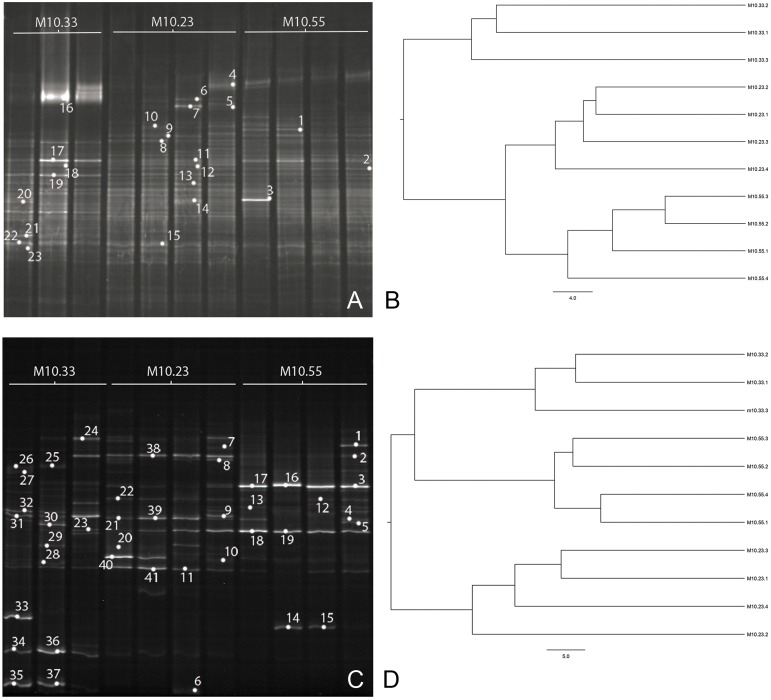
Figure 3.
DGGE profiles of 16S rRNA fragments of bacteria (A) and partial fungal ITS sequences (C) from DNA sample replicates of one non-suppressive (M10.33) and two suppressive (M10.23 and M10.55) soils. Bands marked with numbers correspond to the bands excised from the gel and sequenced. Cluster dendrograms based on UPGMA algorithm show similarity among DGGE band patterns of bacteria (B) and fungi (D). Bar indicates percentage of divergence.

