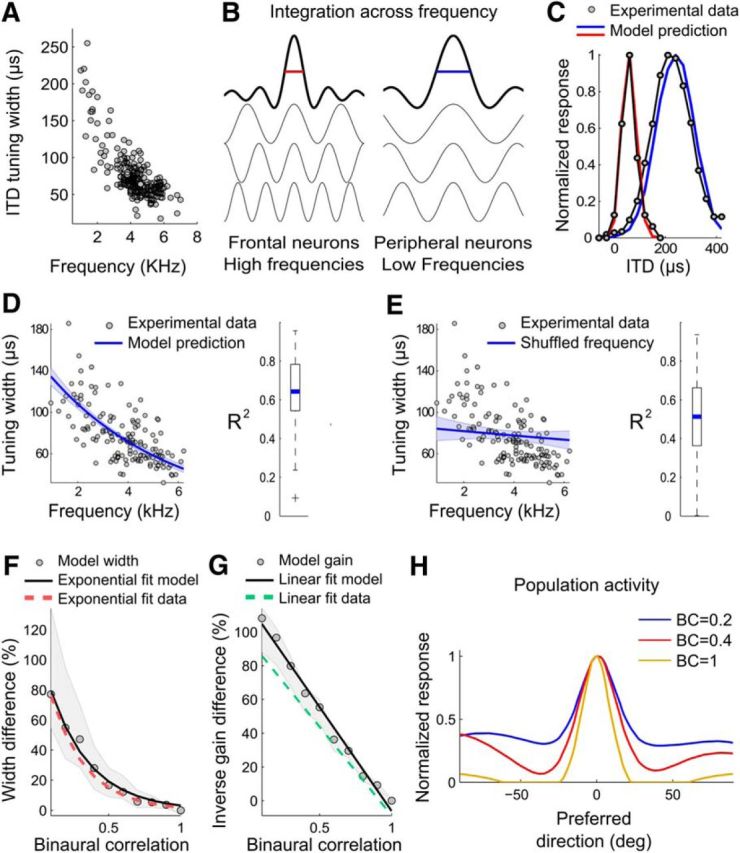
Figure 4.

A cross-correlation model explains ITD-tuning curves. A, Widths of ITD-tuning curves as a function of the stimulus frequency in ICx neurons. B, Schematic ITD tuning shaped by the integration range across frequency. The ITD-tuning curves generated from high frequencies (red) are narrower than those generated from low frequencies (blue). C, Examples of experimental ITD-tunings (gray) and cross-correlation model predictions for narrow (red) and broad (blue) curves, where the broader curve is tuned to a larger ITD. D, Experimental ITD-tuning width (gray dots) decreases as a function of best frequency. A cross-correlation model that takes into account experimental frequency weights predicts the exponential fit of the data (blue line). The 95% confidence intervals of the fit are shown by the upper and lower edges of the shaded areas. The box-plot on the right shows the median (blue) and the quartiles of the coefficients of determination (r2) between experimental and modeled curves. E, Same as in D but overlapping data with the model's prediction after shuffling frequency weights. The model no longer predicts the increase in width with best frequency, demonstrating the dependence of the shape of ITD-tuning curves on the specific frequency weights for each neuron. F, G, Model predictions of width and gain changes as a function of binaural correlation. Median (gray circles) and quartiles (shaded areas) of the proportional difference between BC = 1 and lower BCs (0.9 to 0.1) in width (F) and the inverse of the square root of the gain (G). The exponential (F) and linear (G) fits are indicated by black lines. Red and green dashed lines show the exponential and linear fits from the data. H, Modeled population activity in response to a stimulus at ITD = 0 is less selective at low BC than at high BC.
