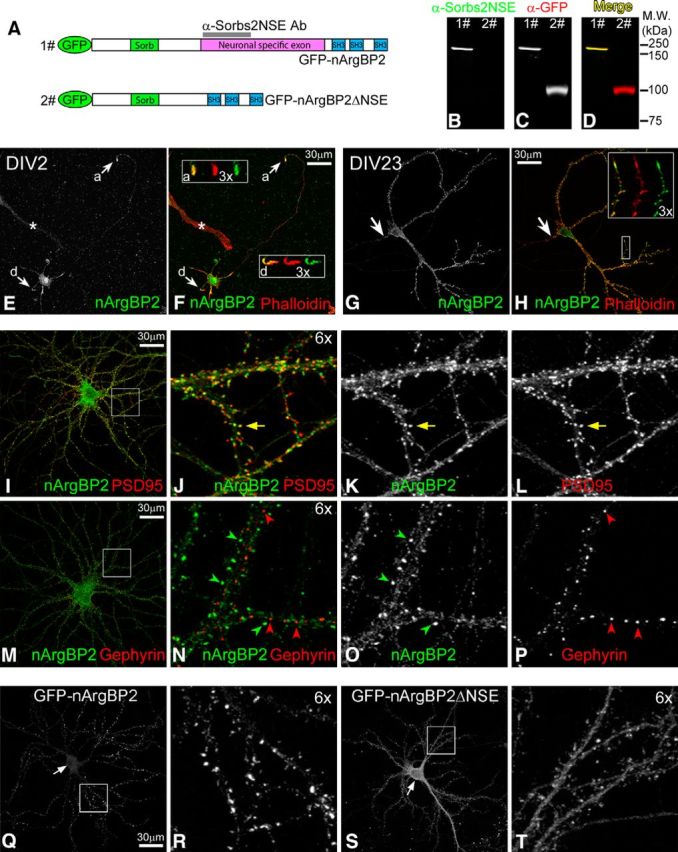
Figure 1.

nArgBP2 distribution in cultured neurons. A, Domain diagram of GFP-nArgBP2 and GFP-nArgBP2ΔNSE fusion proteins. Sorb, Sorbin homologous domain; SH3, Src homology 3 domain. Magenta bar represents the position of NSE. Gray bar represents the antigen region used to generate anti-Sorbs2NSE antibody. B–D, Anti-Sorbs2NSE antibody specifically recognizes GFP-nArgBP2 (lane 1) but not GFP-nArgBP2ΔNSE (lane 2) fusion protein by Western blot. E, F, Localization of nArgBP2 in low-density cultured hippocampal neuron at 2 DIV (DIV2). Arrow and box “a” represent axonal growth cone. Arrow and box “d” represent the dendritic growth cone. Images in the boxes represent 3× enlarged view of growth cones: merged images (left) of Phalloidin (middle) and nArgBP2 (right). A non-neuronal cell labeled by asterisk shows the background staining from anti-Sorbs2NSE antibody. G, H, Localization of nArgBP2 in low-density cultured hippocampal neuron at DIV23. Arrow indicates axonal initial segment; 3× magnified view of a dendritic segment shows the colocalization (merged image, left) of Phalloidin (middle) and nArgBP2 (right) at dendritic growth cone and spines. I–L, Distribution of nArgBP2 and PSD95 in low-density cultured hippocampal neurons. Yellow arrow indicates the colocalization of nArgBP2 with PSD95. M–P, Distribution of nArgBP2 and Gephyrin in low-density cultured hippocampal neurons. Green and red arrowheads point to puncta enriched with nArgBP2 and Gephyrin, respectively. Q–T, Distribution of exogenous GFP-nArgBP2 and GFP-nArgBP2ΔNSE fusion proteins in medium-density cultured cortical neurons. Arrows indicate the position of neuronal cell body, where GFP-nArgBP2 is less enriched than GFP-nArgBP2ΔNSE (Q, S). Enlarged boxed regions highlight enrichment of GFP-nArgBP2 at spines (R) and have uniform distribution of GFP-nArgBP2ΔNSE (T).
