
Figure 2.
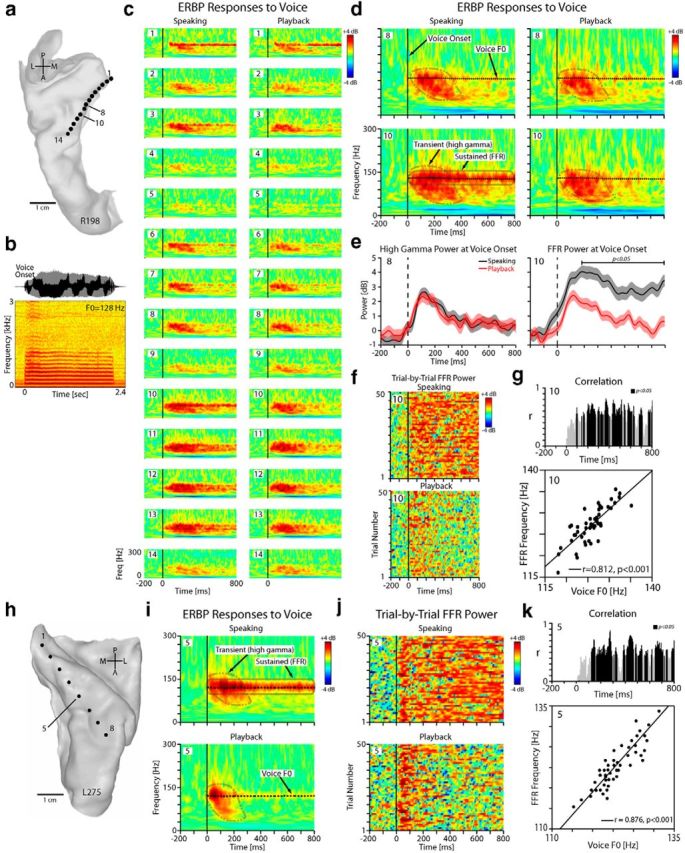
Responses to voice recorded from HG in one right-hemisphere (R198) and one left-hemisphere (L275) subject. a, Top-down view of right superior temporal plane MRI reconstruction showing location of each HDE contact within HG in R198. b, The waveform and spectrogram of a natural vowel sound vocalization for R198. c, Anatomical distribution of ERBP responses (1–300 Hz, ±4 dB) during speaking (left column) and playback (right column) showing strong responses relative to voice onset (time 0, vertical black line) in posteromedial two-thirds of HG in R198. Reference period is −500 to −200 ms before voice onset (i.e., during silence). d, Blown-up time-frequency plots for two representative contacts (#8, #10) in R198 showing transient high gamma responses and sustained FFRs relative to vocalization onset (time 0, solid vertical line). The overlaid dashed black line shows the mean voice F0. e, ERBP profile centered at mean voice F0 (128 ± 5 Hz) in R198 during speaking and playback depicting speaking-induced FFR modulation at contact 10 (right; paired t test, p < 0.05), but no such modulation of FFR is evident at contact 8 (left). f, The raster plot of the trial-by-trial FFR power for contact 10 in R198 during speaking and playback conditions. g, Top, Trajectory of sliding correlation between FFR and voice F0. Bottom, Correlation between trial-by-trial frequency band of the FFR and voice F0 produced for contact 10 during speaking in R198 (r = 0.812, p < 0.001). h, Top-down view of left superior temporal plane in L275. i, Blown-up time-frequency plots for contact 5 in L275 showing transient high gamma responses and sustained FFRs. j, The raster plot of the trial-by-trial FFR power for contact 5 in L275 during speaking and playback conditions. k, Correlation between trial-by-trial frequency band of the FFR and voice F0 produced for contact 5 in L275 during speaking (r = 0.867, p < 0.001).