
Figure 4.
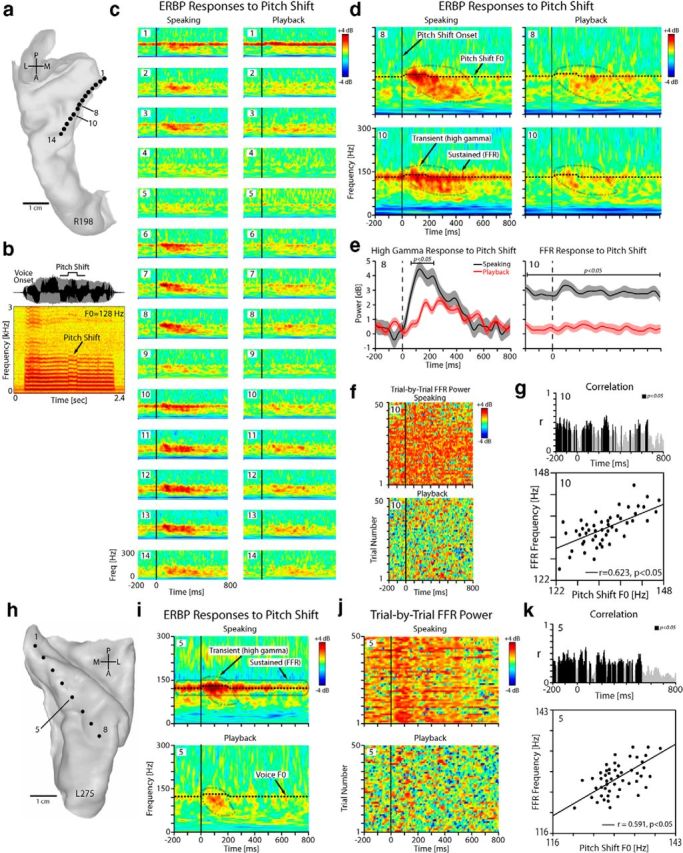
Modulation of HG responses by pitch shift in one right-hemisphere (R198) and one left-hemisphere (L275) subject. a, Top-down view of right superior temporal plane MRI reconstruction showing location of each HDE contact within HG for subject R198. b, The waveform and spectrogram of the pitch-shifted vocalization feedback for R198. c, Time-frequency plots of the ERBP responses to pitch-shifted auditory feedback during speaking (left column) and playback (right column) for all electrode contacts positioned within HG in R198. d, Blown-up version of the time-frequency plots for two representative contacts (#8, #10) in R198 showing transient high gamma power increase in responses to pitch-shift stimulus relative to a reference period from −500 to −200 ms before pitch shift onset. The ongoing FFRs are subtracted out from these plots due to the choice of the reference period. e, The profile of the high gamma responses to pitch shift for contacts 8 and 10 overlaid during speaking and playback in R198. f, The raster plot of the trial-by-trial high gamma power increase in response to pitch-shift stimulus for contact 10 in R198 during speaking and playback conditions. g, Top, Trajectory of sliding correlation between FFR and pitch-shifted voice F0. Bottom, Correlation between trial-by-trial frequency band of the FFR and pitch-shifted voice F0 for contact 10 during speaking in R198 (r = 0.623, p < 0.05). h, Top-down view of left superior temporal plane in L275. i, Time-frequency plots for contact 5 in L275 showing transient high gamma responses and sustained FFRs to pitch-shifted stimulus. j, The raster plot of the trial-by-trial FFR power for contact 5 in L275 during speaking and playback conditions in response to pitch-shift stimulus. k, Correlation between trial-by-trial frequency band of the FFR and pitch-shifted voice F0 for contact 5 in L275 during speaking (r = 0.591, p < 0.05).