
Figure 5.
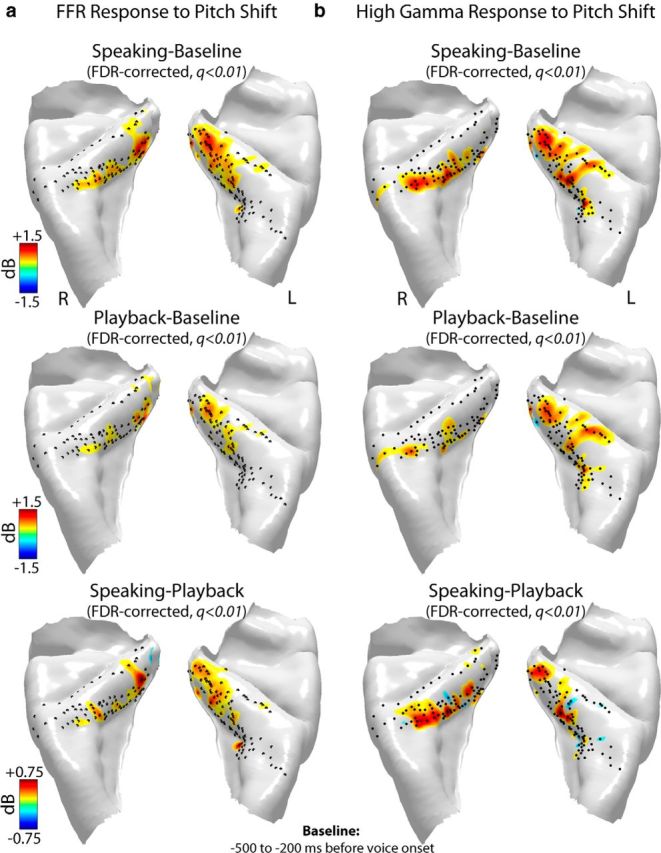
Anatomical distribution of significant (FDR-corrected paired t test, q < 0.01) increases in power of the (a) FFRs and (b) high gamma responses to pitch-shift stimulus during speaking (top row), playback (middle row), and their contrast (speaking − playback; bottom row) in 14 subjects (8 left and 6 right hemisphere implants) mapped onto a template-reconstructed HG surface. Black dots represent locations of recording contacts in these subjects. High gamma responses were calculated as ERBP increase within 75–150 Hz in a time window at 0–400 ms postvoice onset relative to a prevocalization baseline from −500 to −200 ms. FFRs were calculated as ERBP increase at voice F0 (±5 Hz bandwidth) in a postvocalization time window from 400 to 800 ms relative to the prevocalization baseline period from −500 to −200 ms.