
Figure 6.
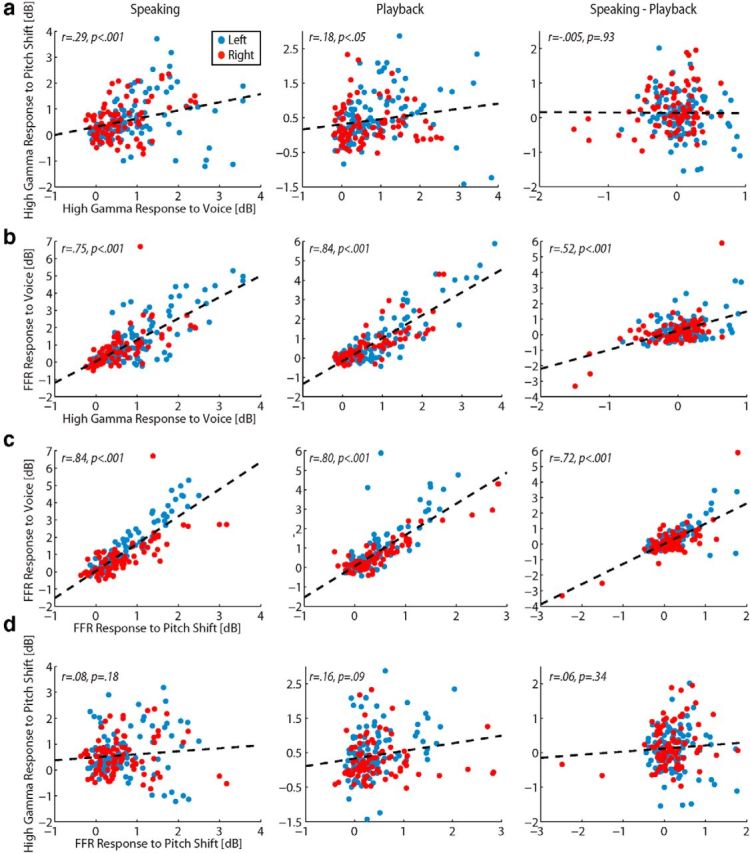
Correlation analyses (Pearson's r method) to examine relationships of FFR and high gamma responses for all conditions. All 107 contacts in the left (blue) and 87 contacts in the right HG (red) for all 14 subjects are shown. a, Correlation of sites showing high gamma responses to pitch shift with high gamma responses to voice only during the speaking condition. b, Strong correlation between sites with FFR responses to voice and high gamma responses to voice. c, Strong correlations between sites with FFRs to voice and pitch shift. No correlation was observed between sites for high gamma responses to pitch shift and FFRs to pitch shift (d).