
Figure 7.
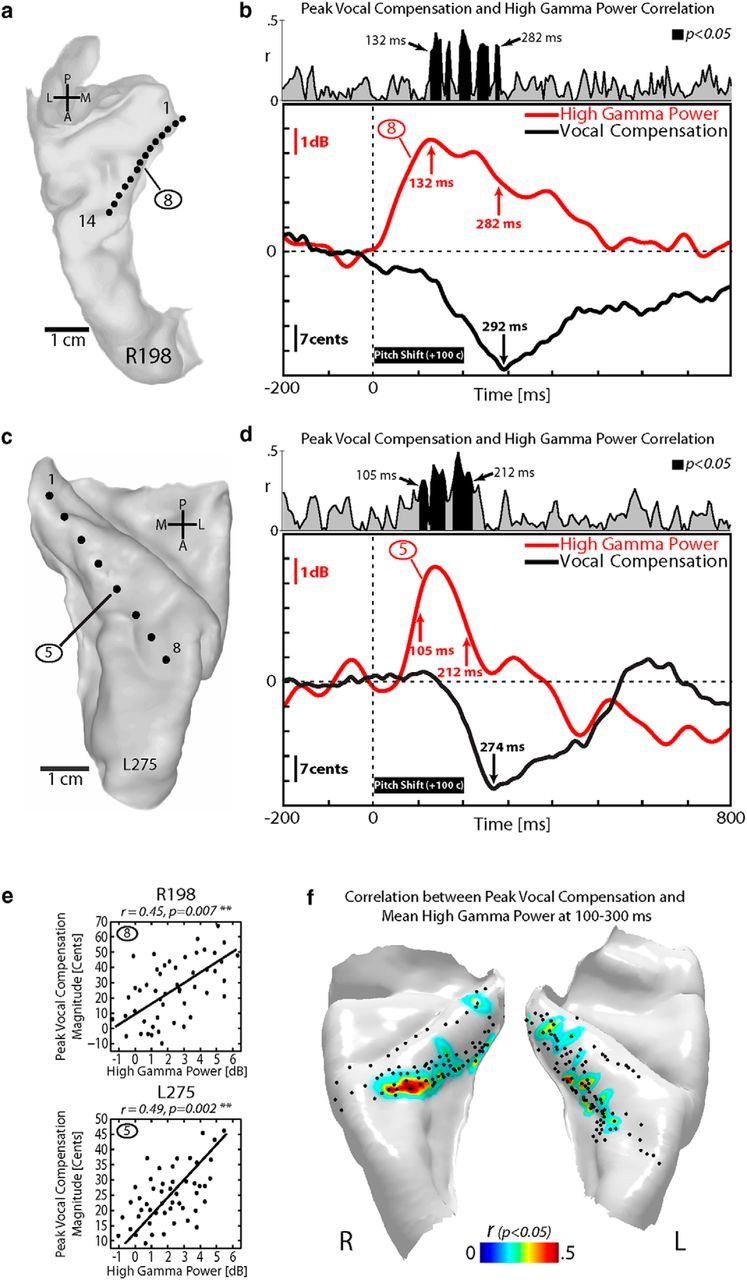
Analysis of behavioral vocal compensation and HG responses to pitch-shift stimulus in one right-hemisphere (R198) and one left-hemisphere (L275) subject. a, Top-down view of right superior temporal plane MRI reconstruction showing HDE recording sites within HG for subject R198. b, Top, Profile of the Pearson's r correlation between high gamma response and the peak magnitude of the compensatory vocal responses to pitch-shift stimuli in R198. Bottom, Mean compensatory vocal response to pitch-shifted auditory feedback during vocalization (black line) overlaid with the profile of high gamma response in a representative HG contact (#8; red line) in R198. Thick black bar represents duration of pitch-shift stimulus (200 ms). c, Top-down view of left superior temporal plane for subject L275. d, Top, Profile of the Pearson's r correlation between high gamma response and the peak magnitude of the compensatory vocal responses to pitch-shift stimuli in L275. Bottom, Mean compensatory vocal response to pitch-shifted auditory feedback during vocalization (black line) overlaid with the profile of high gamma response in a representative HG contact (#5; red line) in L275. e, Single-trial correlation between peak magnitude of vocal responses and high gamma activity for top (the representative HG contact 8 in R198) and bottom (the representative HG contact 5 in L275). f, Anatomical distribution of correlation coefficients between high gamma responses to pitch shifts and peak magnitude of the compensatory vocal responses for all contact in 12 subjects (7 left, 5 right HG) projected onto the average HG template reconstructions.