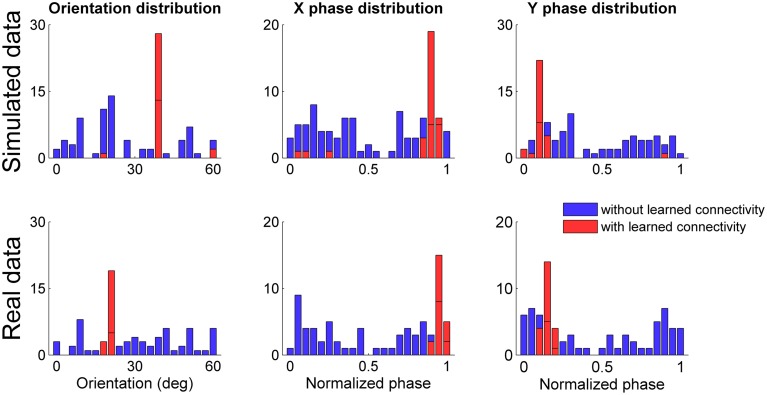
Figure 12.
Distribution of grid orientations and normalized spatial phases for spatial grids (with gridness score >0) generated by grid cells at the center of each simulated network. Distributions refer to both simulated (top panels) and real data (bottom panels) in input, initializing the connectivity from the sensory map to the grid network to a zero matrix (in blue) and to a previously learned connectivity (in red). In both simulated and real conditions the previously learned connectivity drastically reduced the possible grid orientations and phases.

