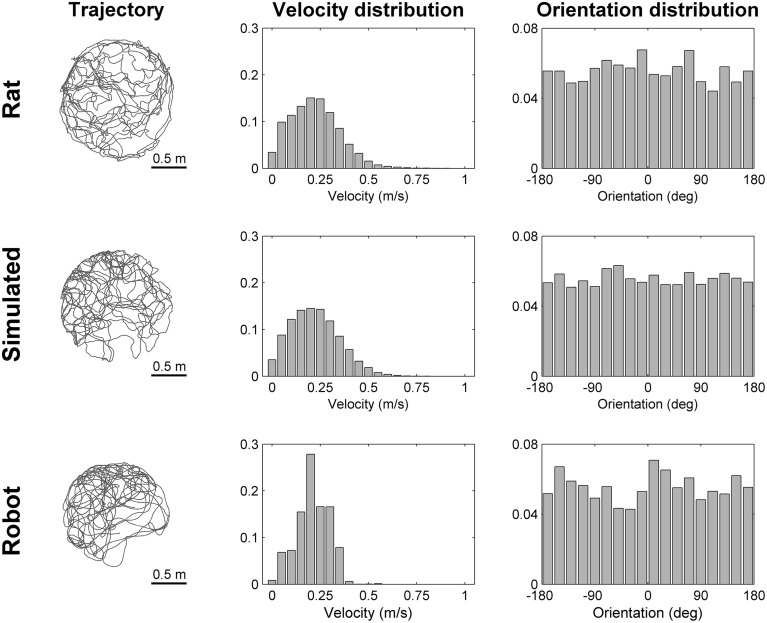
Figure 4.
Comparison of trajectories. The trajectory, the distribution of velocities and the distribution of orientations are shown for a rat (top row), for a simulated robot (middle row), and for a real robot (bottom row) while exploring for 300 s a circular arena of the same size (diameter equal to 1.6 m). The simulated and real robot trajectories resemble the trajectory of a rat with different degrees of approximation (Experimental rat data adapted from Hafting et al., 2005).

